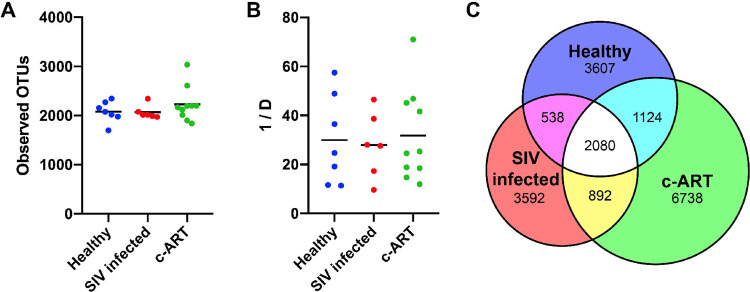
Figure 3.
Alpha diversity of treatment groups. (A) The bacterial richness of each sample, as calculated by the number of observed OTUs. (B) The diversity of each sample as calculated by the inverse Simpson (1/D) diversity calculator, such that the higher the number, the greater the diversity. In (A,B), each symbol represents one sample, with the mean shown as a solid line. No groups were statistically different, as tested by a one-way ANOVA with Tukey’s multiple comparison. (C) Venn diagram showing the number of OTUs shared between each group. All calculations were performed after subsampling.

