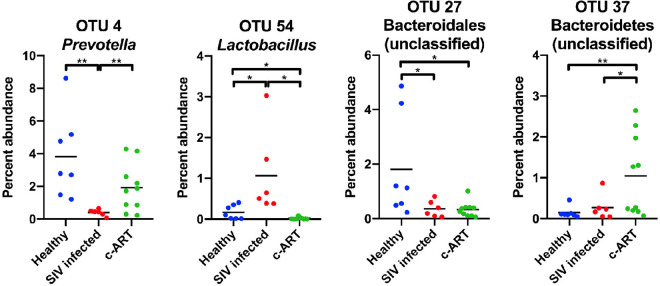
Figure 6.
Scatter plots of representative OTUs identified as statistically different by Metastats. Percent abundance of the OTU is plotted, and each symbol represents one sample, with the mean shown as a solid line. OTUs decreased (OTU4 and OTU27) or increased (OTU54 and OTU37) in mean abundance from healthy to SIV infected, and subsequently increased (OTU4 and OTU37) or decreased (OTU27 and OTU54) from SIV infected to c-ART treated groups. Calculations were performed from a subsampled dataset. Statistical significance was tested by the mothur implementation of Metastats, with P < 0.05 = *, and P < 0.01 = **.

