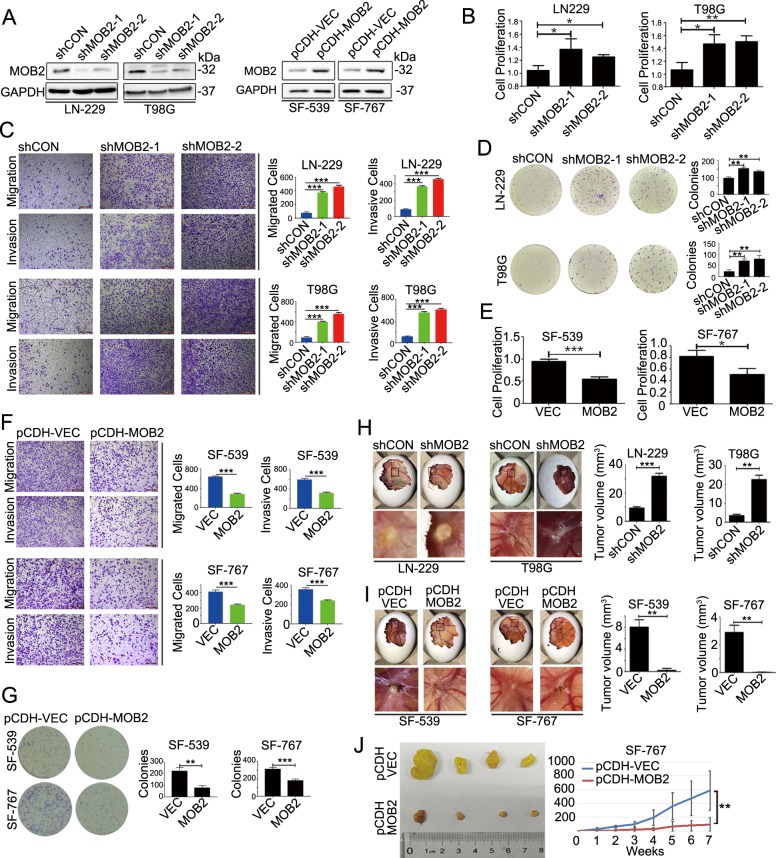
Fig. 2. MOB2 is a tumor suppressor in GBM.
a IB analysis of the efficiency of stable knockdown of MOB2 in LN-229 and T98G cells (shCON and shMOB2)or stable overexpression of MOB2 in SF-539 and SF-767 cells (pCDH-VEC and pCDH-MOB2), GAPDH was used as a loading control. b Cell proliferation rate of MOB2-depleted LN-229 and T98G cells was measured by BrdUrd labeling. c Representative images and quantification of migration and invasion of MOB2-depleted LN-229 and T98G cells. Scale bar = 200 μm. d Cell proliferation of MOB2-depleted LN-229 and T98G cells was measured by colony formation assays. e Cell proliferation rate of SF-539 and SF-767 cells stably expressing MOB2 was measured by BrdUrd labeling. f Representative images and quantification of migration and invasion of MOB2-overexpressed SF-539 and SF-767 cells. Scale bar = 200 μm. g Cell proliferation of SF-539 and SF-767 cells stably expressing MOB2 was measured by colony formation assays. h, i Chick embryos with CAM tumors formed from MOB2-depleted LN-229 and T98G cells (h) or MOB2-overexpressed SF-539 and SF-767 cells (i) were dissected and the size of CAM tumors was calculated. A minimum of ten embryos per condition was analyzed. j Enlarged tumor volumes in MOB2-overexpressed SF-767 cells vs control mice, were measured weekly (7 weeks). All experiments were performed as three independent experiments. Data are presented as mean ± SEM (*p < 0.05, **p < 0.01, ***p < 0.001).

