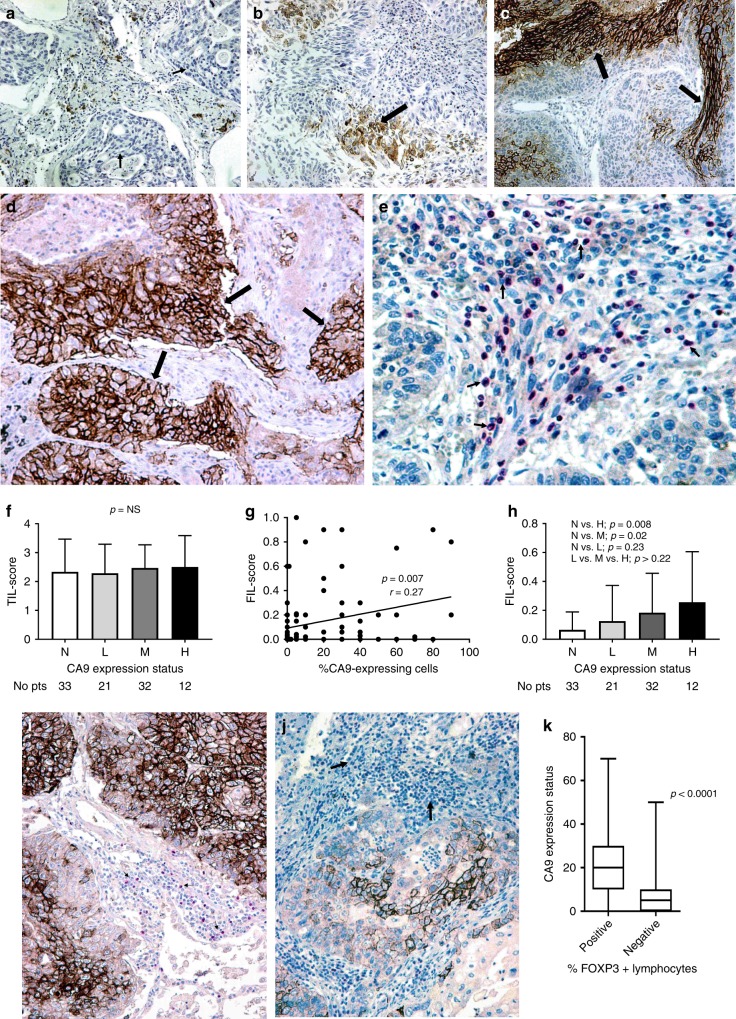
Fig. 1. Immunohistochemical figures and figures showin associations between CA9 expression and lymphocyte-related parameters.
a Immunohistochemical image showing lack (grouped as negative) of cancer cell CA9 reactivity (arrows) in a squamous cell lung cancer (magnification ×20). b Immunohistochemical image showing sporadic (grouped as low) staining (arrows) of cancer cell CA9 reactivity in a squamous cell lung cancer (magnification ×20). c Immunohistochemical image showing CA9 staining (arrows) in less than 50% of cancer cells (grouped as medium) in a squamous cell lung cancer (magnification ×20). d Immunohistochemical image showing extensive membrane CA9 reactivity (arrows) in >50% of cancer cells of a squamous cell lung cancer (magnification ×20). e Immunohistochemical image showing intense infiltration of tumour stroma by FOXP3+ lymphocytes (arrows), in a squamous cell lung cancer (magnification ×40). f TIL score according to the four CA9 expression categories (absence/N vs. low/L vs. medium/M vs. high/H expression). Bars show standard deviation. g Linear regression analysis of the percentage of CA9-expressing cancer cells and the FIL score. h FIL score according to the four CA9 expression categories (absence/N vs. low/L vs. medium/M vs. high/H expression). Bars show standard deviation. i Double immunostaining for CA9 and FOXP3 in a squamous cell lung cancer extensively expressing CA9; arrows show FOXP3+ lymphocytes (magnification ×20). j Double immunostaining for CA9 and FOXP3+ in a squamous cell lung cancer showing poor expression of CA9 in cancer cells, and lack of expression of FOXP3 by tumour-infiltrating lymphocytes (arrows) (magnification ×20). k Percentage of FOXP3+ infiltrating lymphocytes in the stroma according to the extent of expression of CA9 adjacent to the stroma cancer cells, assessed in 20 selected double CA9/FOXP3-immunostained tissue slides. Bars show standard deviation (magnification ×20).

