FIGURE 2.
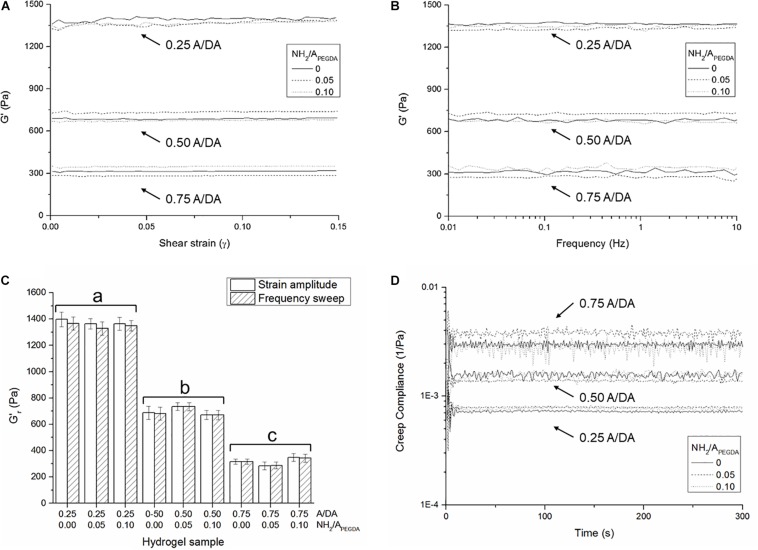
Averaged storage shear moduli (n = 3 independent samples per formulation) measured as a function of (A) shear strain and (B) applied frequency, for all investigated hydrogel formulations. (C) Hydrogel shear storage moduli in the relaxed state () derived from both strain amplitude and frequency sweep measurements. Different letters indicate significant differences between samples (one-way ANOVA, p < 0.05). (D) Shear creep compliance during the creep phase. Note that the initial oscillations at the beginning of the creep experiments are likely due to the inertia of the measuring instrument (Baravian and Quemada, 1998).

