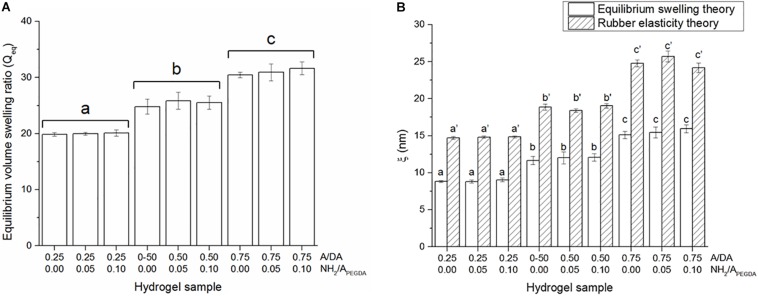
FIGURE 3.
(A) Equilibrium volume swelling ratios (Qeq). Different letters indicate significant differences between samples (one-way ANOVA, p < 0.05). (B) Hydrogel mesh size estimations (ξ) obtained either with equilibrium swelling and rubber elasticity theories. Different letters indicate significant differences between samples (one-way ANOVA, p < 0.05). Letters with no sign are referred to ANOVA results of ξ calculated using equilibrium swelling data, whereas those with an apostrophe indicate ANOVA results obtained for ξ estimated from mechanical data.

