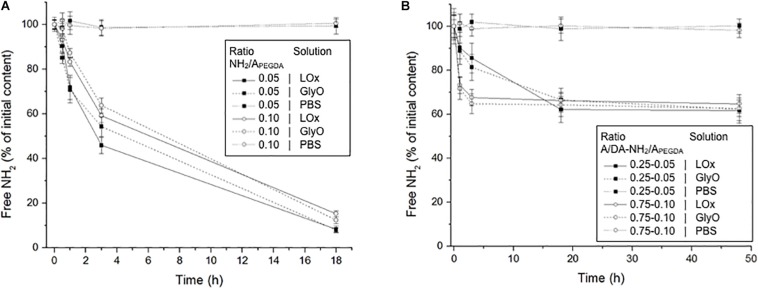
FIGURE 4.
(A) Free amino content measured over time for both the 0.75 to 0.05 (black squares) and the 0.75 to 0.10 (white circles) A/DA-NH2/APEGDA soluble models incubated with LOx, GlyO (positive control) and PBS (negative control). (B) Free amino content measured over time for both the 0.25 to 0.05 (black squares) and the 0.75 to 0.10 (white circles) A/DA-NH2/APEGDA crosslinked hydrogels incubated with LOx, GlyO or PBS. Each free amine time series was analyzed independently and found statistically different (one-way ANOVA, p < 0.05).

