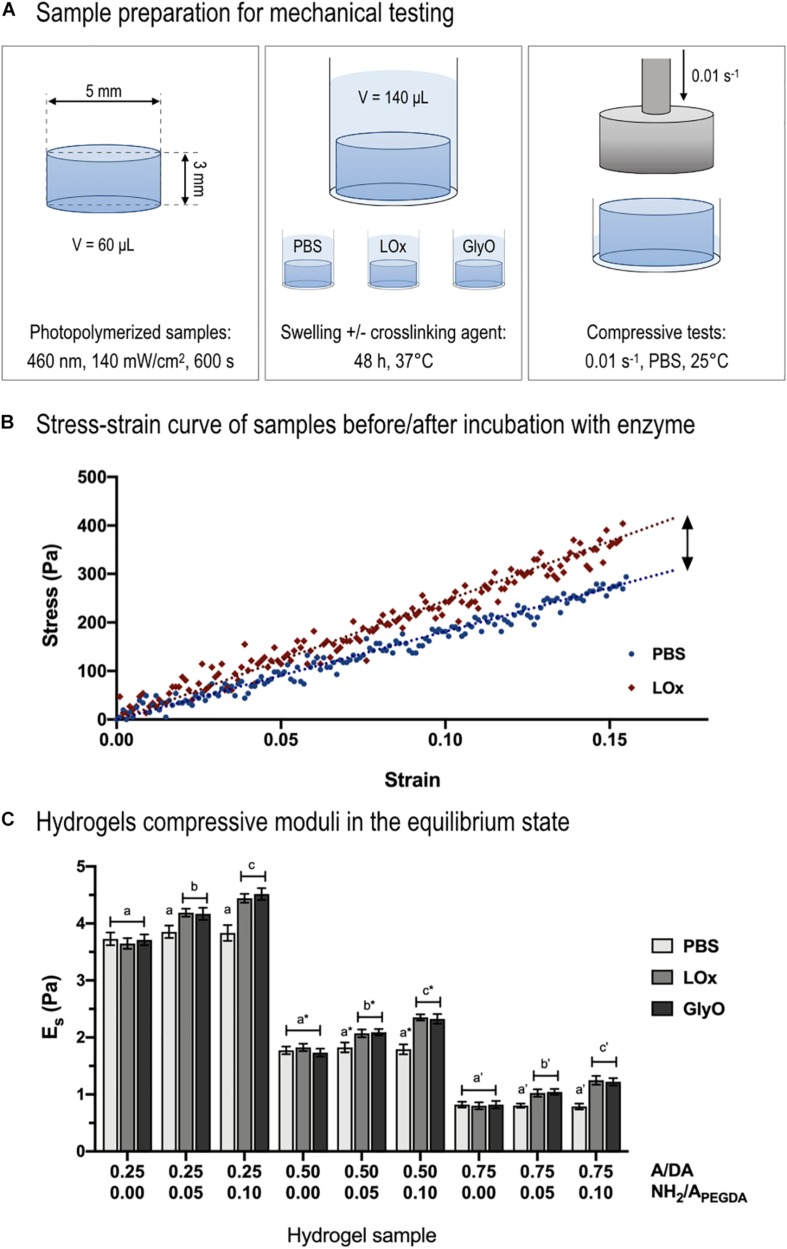
FIGURE 5.
Compressive mechanical tests. (A) Schematic representing sample preparation for mechanical testing. (B) Example of stress–strain curve of 0.50 to 0.10 A/DA-NH2/APEGDA hydrogel before (blue dots) and after incubation with LOx (red diamonds). Typical linear fitting curve data within 15% strain (blue and red dotted lines) are displayed to show the linear (elastic) behavior of hydrogels during compression. (C) Hydrogel compressive moduli (Es) measured after incubation with LOx, GlyO (positive control) or PBS (negative control). One-way ANOVA was performed considering each A/DA hydrogel family independently, with differences p < 0.05 considered statistically different. Letters with no sign indicate ANOVA results obtained analyzing the 0.25 A/DA hydrogel family, whereas letters with an asterisk and those with an apostrophe are referred to ANOVA results obtained for the 0.50 and the 0.75 A/DA families, respectively. Different letters indicate significant differences between samples (p < 0.05).

