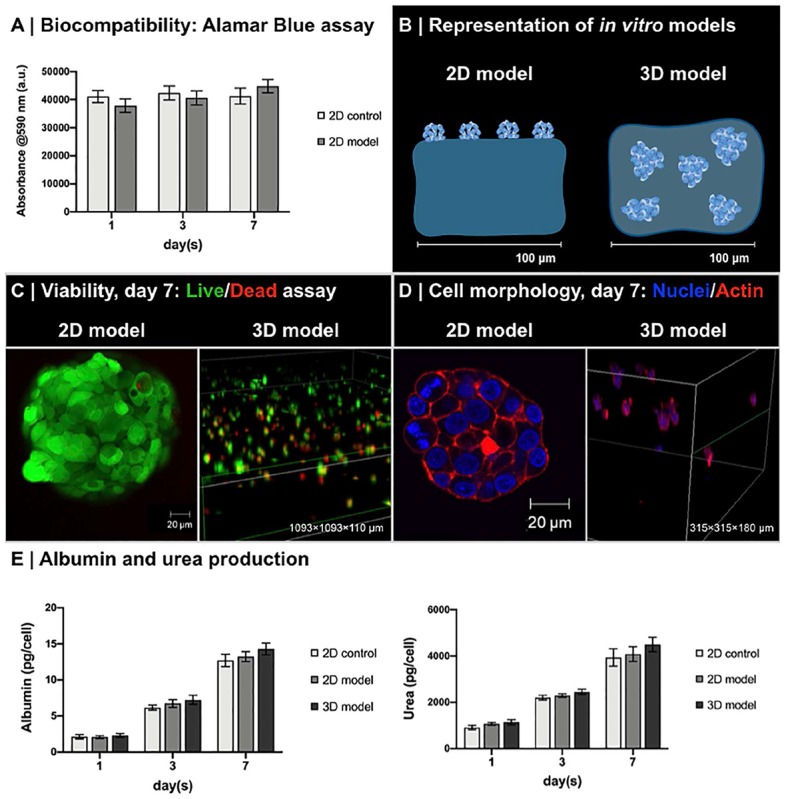
FIGURE 6.

Biocompatibility of enzyme-responsive material. (A) Viability of HepG2 seeded on the top of 0.50 to 0.10 A/DA-NH2/APEGDA (2D model) and collagen gels (2D control). Data are reported as average ± standard deviation (n = 4 independent experiments). No significant differences were observed at different time points (one-way ANOVA, p < 0.05). (B) Representation of in vitro 2D model and 3D model with HepG2. (C) Live/dead assay of HepG2 in 2D and 3D models. Clusters of live (green) and dead (red) HepG2 cells were observed in both 2D models (detail of HepG2 on 0.50 to 0.10 A/DA-NH2/APEGDA) and in 3D models (volumetric rendering of HepG2 in 0.50 to 0.10 A/DA-NH2/APEGDA hydrogels, large view). (D) HepG2 morphology in 2D and 3D models. Immunofluorescence staining for cell nuclei (DAPI, blue) and F-actin filaments (phalloidin, red): clusters of HepG2 were observed in both 2D models (detail of HepG2 on 0.50 to 0.10 A/DA-NH2/APEGDA) and in 3D models (volumetric rendering of HepG2 in 0.50 to 0.10 A/DA-NH2/APEGDA hydrogels, large view). (E) Albumin and urea production normalized against the number of HepG2 over time for 2D model and 3D model. Collagen gels with HepG2 seeded on the top were used as a control (2D control). Data are reported as average ± standard deviation (n = 4 independent experiments). No significant differences were observed at different time points (one-way ANOVA, p < 0.05). Of note, albumin was produced with an average rate of 1.99 ± 0.16 pg/cell per day (2D control), 2.07 ± 0.18 pg/cell per day (2D model), and 2.25 ± 0.19 pg/cell per day (3D model), whereas urea was produced with an average rate of 736.57 ± 174.56 pg/cell per day (2D control), 806.68 ± 246.89 pg/cell per day (2D model), and 866.70 ± 253.41 pg/cell per day (3D model). Production rates of both albumin and urea were similar in the models tested with respect to control.
