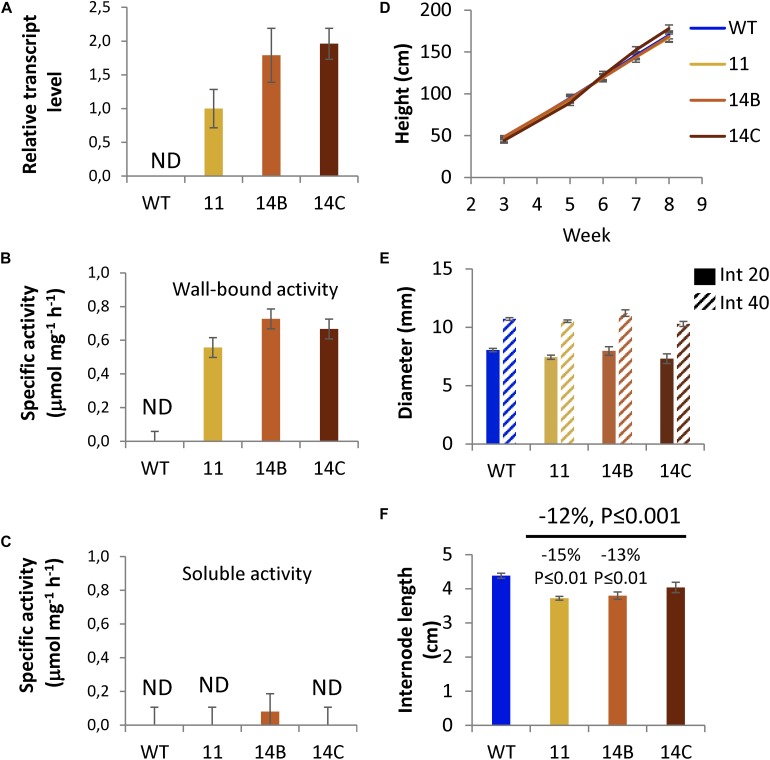
FIGURE 1.
Growth and transgene expression in selected WP:CE5 lines (11, 14B, and 14C) used in this study compared to wild type (WT). (A) Transgene transcript levels in developing wood determined by RT-qPCR; the expression relative to two reference genes was normalized to the levels observed in line 11. AXE specific activity in wall-bound (B) and soluble (C) protein fractions isolated from developing wood, determined by release of acetic acid from acetylated aspen wood powder used as substrate. Data in (A–C) are means ± SE, N = 3, biological replicates. (D) Height growth of transgenic lines during 8 weeks in the greenhouse. (E) Diameter of internodes 20 and 40 at week 8. (F) Average internode length at week 8. Data in (D–F) are means ± SE, N = 6 trees per transgenic lines and 23 trees per WT. P-values correspond to post-ANOVA Dunnett test (for individual lines) or contrast analysis comparing all transgenic lines to WT.

