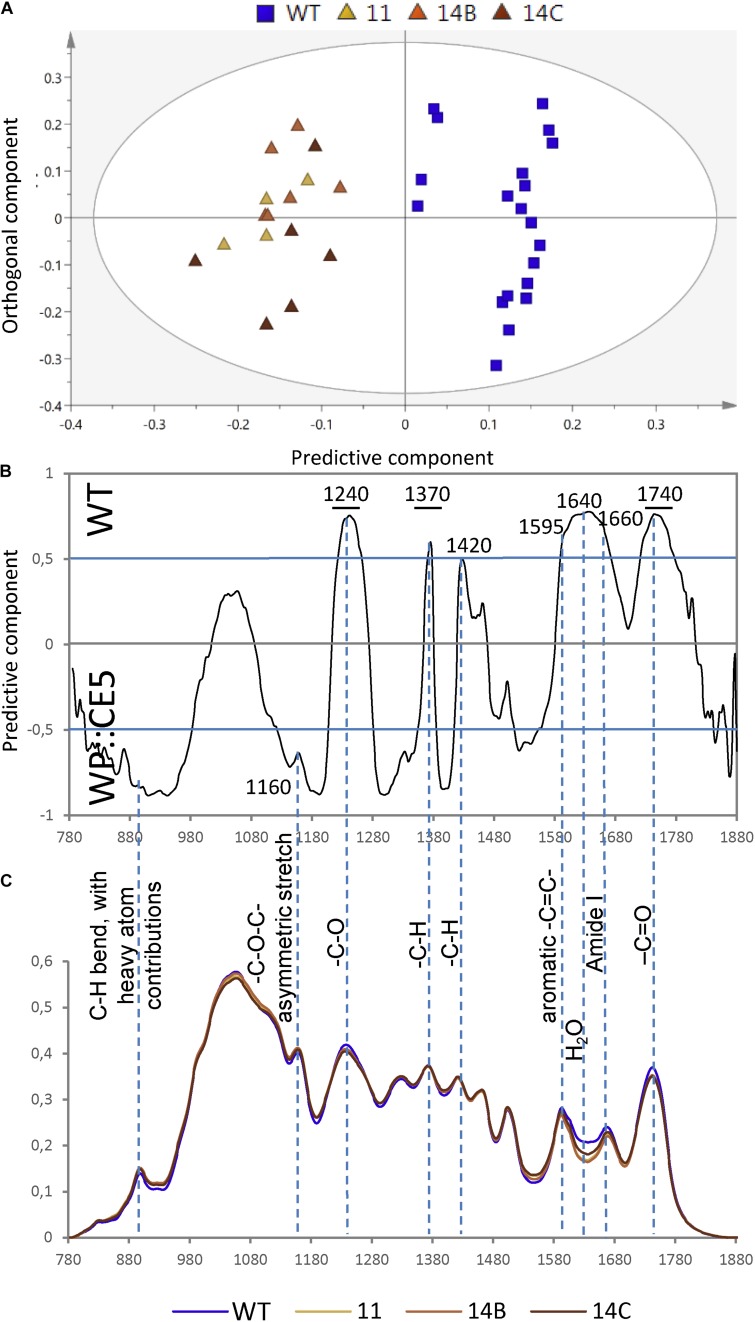
FIGURE 2.
Diffuse reflectance Fourier-transform infrared (FTIR) spectra of wood of WP:CE5 transgenic (lines 11, 14B, 14C) and wild type (WT). Dotted lines show bands that are significantly different (≥50% correlation) in the transgenic lines compared to WT, according to OPLS-DA (orthogonal projections to latent structures – discriminant analysis) models using 1 + 1 (predictive + orthogonal) components. Model components are: R2X (cum) = 0.788, R2Y (cum) = 0.891, Q2 (cum) = 0.878. Score plot (A), loadings (B) and the corresponding average spectra (C).

