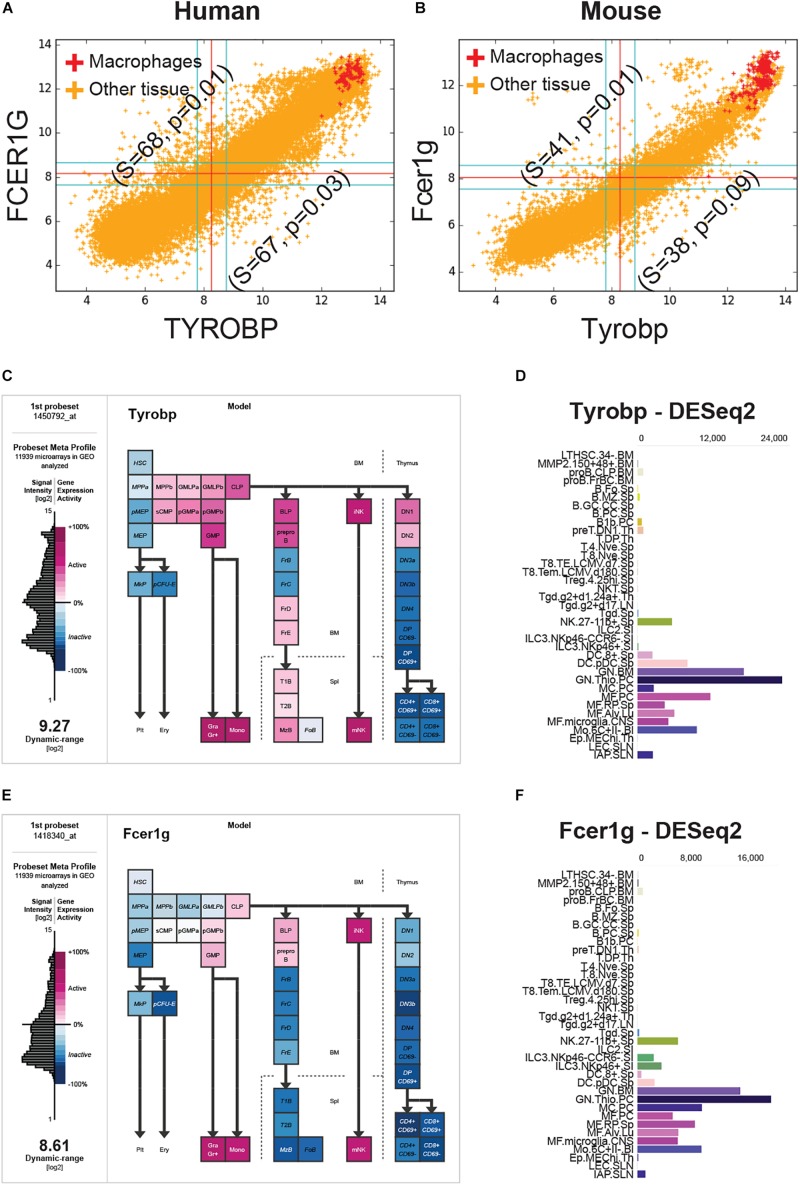
FIGURE 2.
FCER1G and TYROBP expression patterns in human and mouse datasets. (A) A scatterplot of TYROBP and FCER1G in human microarray dataset (n = 25,955, GSE119087) with macrophage samples (A subset of GSE134312, n = 106) are highlighted in red and the rest of them are in orange color. Every point in the scatterplot is a microarray experiment in Human U133 Plus 2.0 Affymetrix platform. (B) A scatterplot of Tyrobp and Fcer1g in mouse microarray dataset (n = 11,758, GSE119085) in Affymetrix Mouse 430 2.0 platform. Similar to panel A, macrophage samples (GSE135324, n = 327) are highlighted in red color and the rest of them are in orange color. (C) Expression patterns of Tyrobp in gene expression commons (GEXC). (D) Tyrobp gene expression in Immunological Genome Project (ImmGen) ULI RNASeq dataset (GSE127267) obtained using skyline data viewer from ImmGen website. (E) Expression patterns of Fcer1g in gene expression commons (GEXC). (D) Fcer1g gene expression in ImmGen ULI RNASeq dataset (GSE127267) obtained using skyline data viewer from ImmGen website. (C,E) The data is organized in terms of hematopoietic stem cell differentiation hierarchy and heatmap color code is specified in the figure. (D,F) Gene skyline from ImmGen shows the different purified hematopoietic cell types that were profiled using RNASeq approach.

