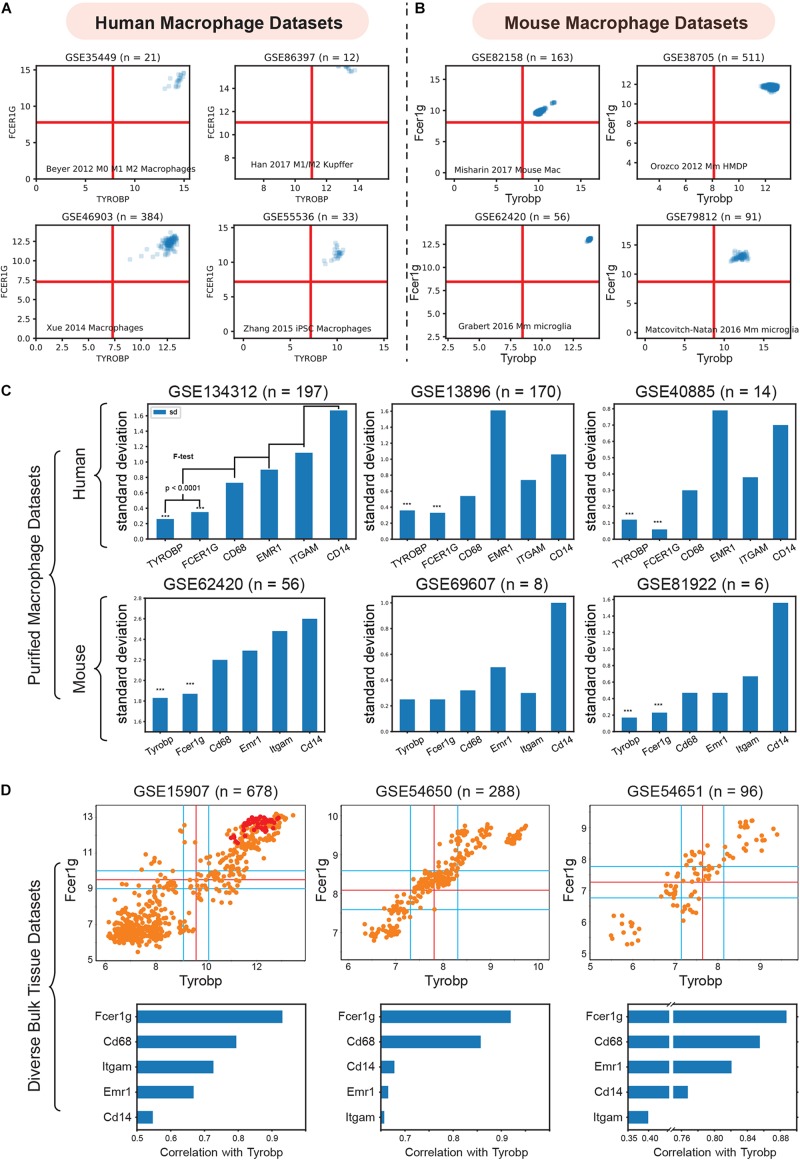
FIGURE 3.
Validation of TYROBP and FCER1G as a universal biomarker of macrophage. (A) Expression patterns of TYROBP and FCER1G in four purified human macrophage datasets: (GSE35449, n = 21), (GSE85333, n = 185), (GSE46903, n = 384), (GSE55536, n = 33). (B) Expression patterns of Tyrobp and Fcer1g in four purified mouse macrophage datasets: (GSE82158, n = 163), (GSE38705, n = 511), (GSE62420, n = 56), and (GSE86397, n = 12). (C) Standard deviation of TYROBP and FCER1G is compared (F-test) to commonly used macrophage biomarker CD68, EMR1, ITGAM, CD14 in purified macrophage datasets in human and mouse, Only pooled macrophage dataset (GSE134312, n = 197) was part of training data and the rest are independent validation dataset. (D) Pearson’s correlation analysis of Fcer1g, Cd68, Emr1, Itgam, Cd14 with Tyrobp shown as a barplot below the scatterplot between Tyrobp and Fcer1g in three independent bulk tissue datasets. Red colored points represent purified macrophage samples while the orange points represent other cell of tissue types.

