FIGURE 4.
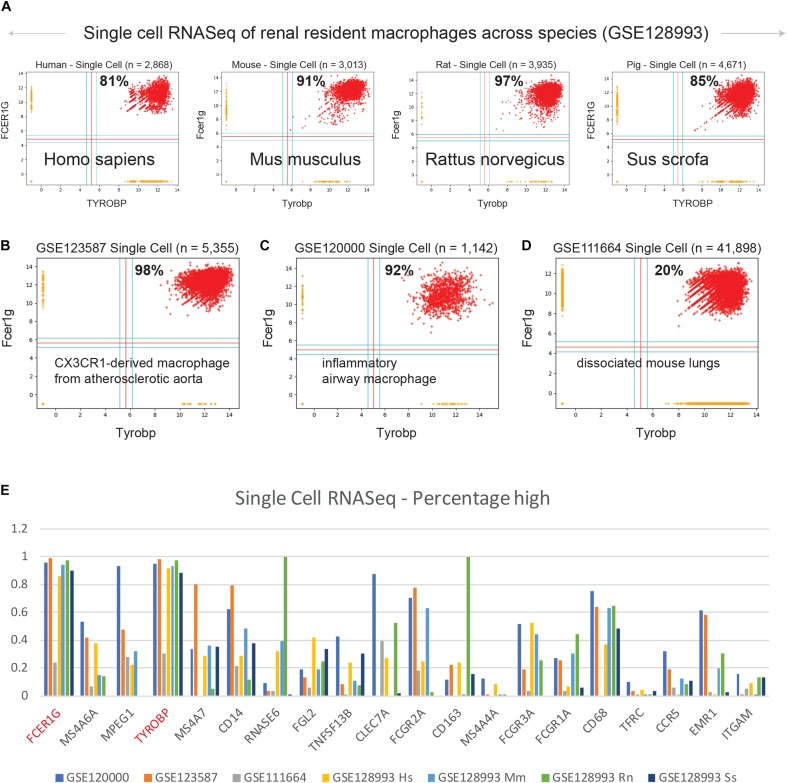
Validation of TYROBP and FCER1G in single cell RNASeq datasets. Scatterplots of expression patterns for TYROBP and FCER1G is shown in several public single cell RNASeq datasets. Red color points denote TYROBP high and FCER1G high samples. Percentage of red points are computed for each scatterplot. Homologous genes are considered for data in mouse, rat and pig. (A) renal resident macrophages across species (GSE128993; human n = 2,868, mouse n = 3,013, rat n = 3,935, pig n = 4,671), (B) mouse CX3CR1-derived macrophage from atherosclerotic aorta (GSE123587; n = 5,355), (C) mouse inflammatory airway macrophages (GSE120000; n = 1,142), and (D) mouse dissociated whole lung tissue (GSE111664; n = 41,898). (E) A bar plot of gene expression values for all 13 genes identified by BECC analysis with seed gene CD14, and the common macrophage genes such as CD16 (FCGR3A), CD64 (FCGR1A), CD68, CD71 (TFRC), CCR5, EMR1, ITGAM, in all the above single cell RNASeq datasets. TYROBP and FCER1G are highlighted in red color.

