Figure 2.
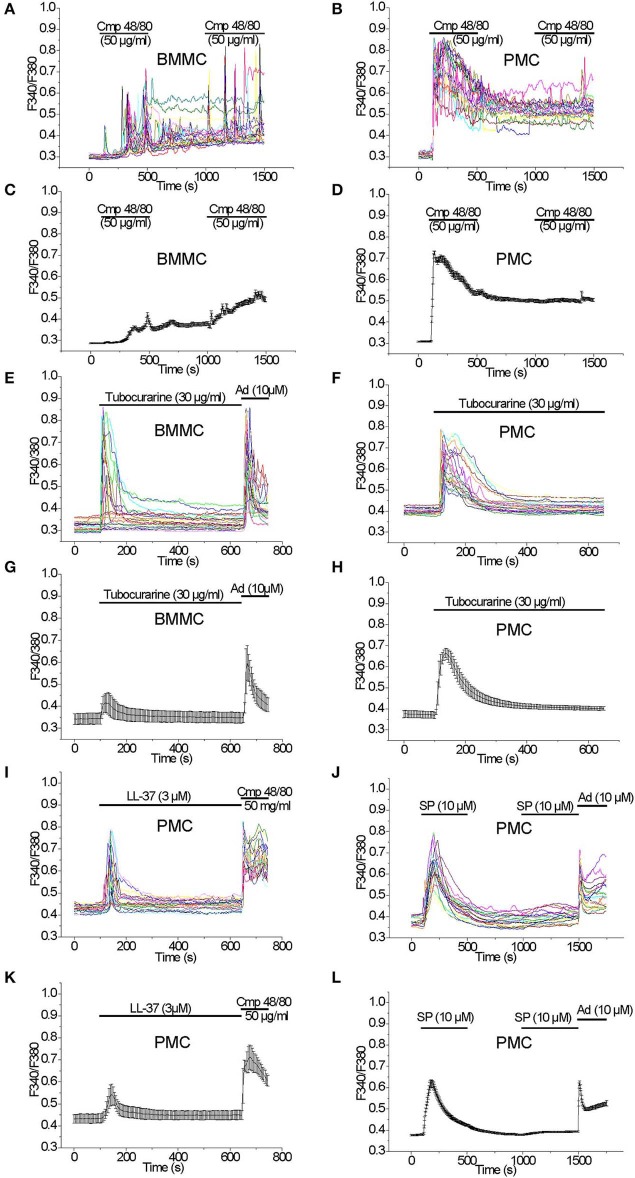
[Ca2+]i rise induced by Mrgprb2 agonists in BMMC and PMC. Measurements of [Ca2+]i changes performed with Fura-2 and presented as F340/F380 fluorescence ratio in BMMC (A,C,E,G) and PMC (B,D,F,H–L) isolated from WT mice. Representative traces (n = 20 each panel) of [Ca2+]i changes (error bars indicate S.E.M.) induced by application of: 50 μg/ml Compound 48/80 (A–D), 30 μg/ml Tubocurarine (E–H), 3 μM LL-37(I,K), 10 μM Substance P (J,L). The measurements were performed in 3–5 independent cell preparations. At the end of recordings, control reactions were elicited by application of 10 μM adenosine “Ad” (E,G,J,L) or by application of 50 μM Compound 48/80 “Cmp” (I,K).

