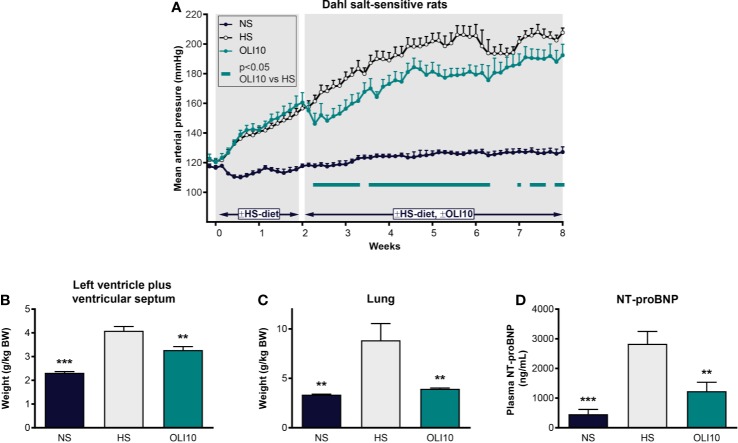
Figure 5.
Effect of olinciguat on blood pressure, cardiac weights, lung weights, and NT-proBNP in Dahl salt-sensitive rat. (A) Mean arterial pressure vs time profiles in NS and HS controls, and HS rats treated with olinciguat 10 mg/kg (OLI10). HS groups were put on the HS diet starting Week-2. Olinciguat treatment was started on Week 0. Data are plotted as daily average MAP + SEM. (B) Weight of left ventricular wall plus ventricular septum normalized to BW. (C) Lung weight normalized to BW. (D) Plasma NT-proBNP. Data in (B–D) are plotted as mean + SEM, **p < 0.01, ***p < 0.001 vs HS control. For the OLI10 group, MAP measurements that were significantly (p < 0.05) lower than vehicle-treated rats are indicated by filled rectangles.

