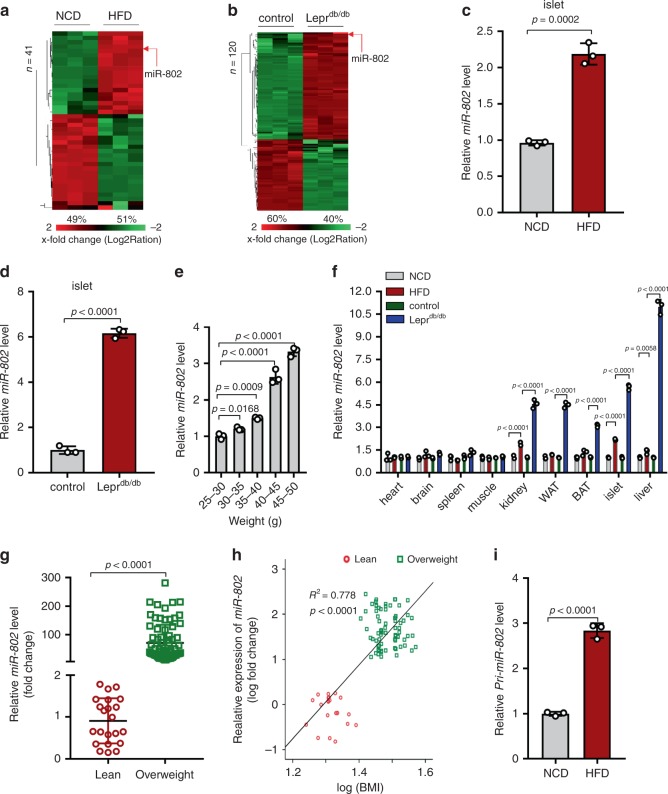
Fig. 1. miR-802 expression level in obese mice and obese individuals.
Heat map diagram illustrating the differential expression of miRNAs in islets of HFD compared to normal chow-diet (NCD) mice (a), n = 8 NCD group and n = 7 HFD group), and in Leprdb/db compared to wide type control mice (b) (n = 8 control group and n = 7 Leprdb/db group). Red and green indicate increased and decreased gene expression levels, respectively. miR-802 was significantly upregulated in islets of HFD mice (c), and Leprdb/db mice (d) (n = 7) compared to NCD and wild type control as measured by qRT-PCT. e qRT-PCR was performed to measure the expression level of miR-802 in the islets at different stages (after 0-week, 4-week, 6-week, 8-week and 16-week feeding HFD) during the development of obesity inducing diabetes (n = 5). f qRT-PCR was performed to evaluate the expression levels of miR-802 in different tissues of obese and wild type mice (n = 7). g The expression levels of miR-802 in the serum extracted from lean individuals (n = 22) and overweight individuals (n = 72), using Ce-miR-39-1 as positive control. miR-802 expression was set to 1 in SD. Data sets were statistically analyzed using two-tailed unpaired Student’s t test and Bonferroni Post-hoc correction. h Correlation between miR-802 levels and BMI. Pearson’s correlation coefficients (r) and p values are shown. i The expression level of Pri-miR-802 in the islets of HFD and NCD mice were analyzed by qRT-PCR (n = 3). All experiments above were performed in triplicates, and each group contained three batches of individual samples. The p-values by Pearson’s correlation test h, two-tailed unpaired Student’s t test c, d, g, and i, one-way ANOVA e, or two-way ANOVA f are indicated. Data represent the mean ± SD. Source data are provided as a Source Data file.

