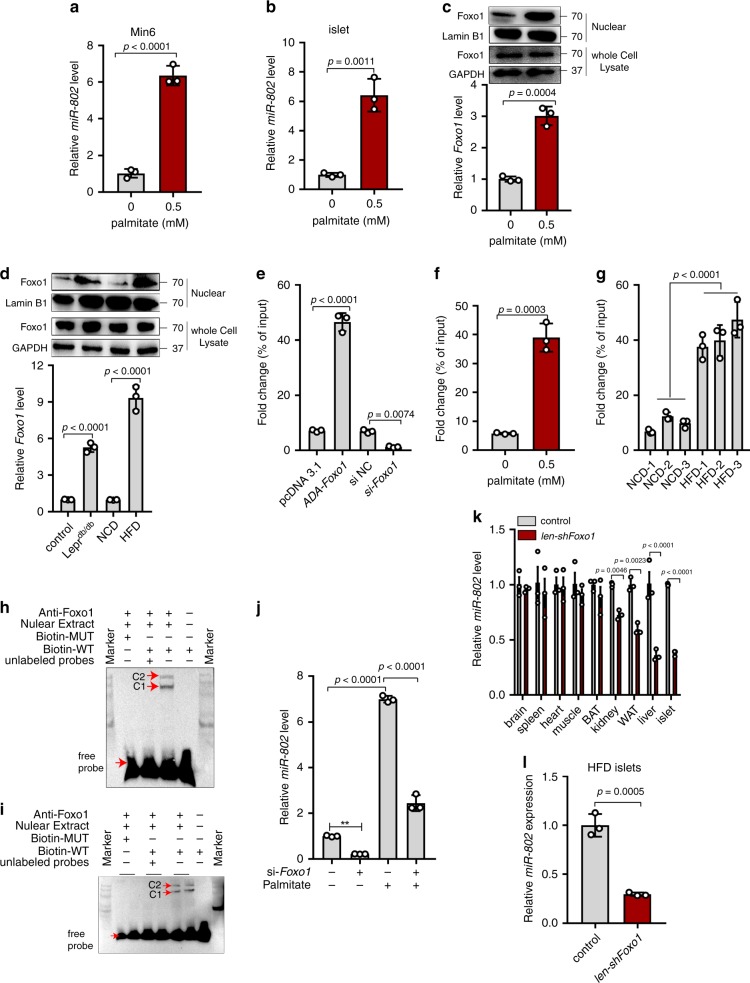
Fig. 2. Foxo1 induces miR-802 expression.
Min6 cells and primary islets were incubated with 0.5 mM primary for 48 h and qRT-PCR was performed to examine the miR-802 levels, in Min6 cells (a), and in primary islets (b). c Primary islets were incubated 0.5 mM palmitate for 48 h, the nuclear and whole cell lysate protein and mRNA levels of Foxo1 were determined by western blot and qRT-PCR, respectively. d The nuclear and whole cell lysate protein and mRNA levels of Foxo1 were assessed in the islets of obese model mice using western blot and qRT-PCR, respectively. e–g The enrichment of Foxo1 on the miR-802 promoter relative to IgG detected by ChIP-qPCR assays, in Min6 cells transfected with ADA-Foxo1, pcDNA 3.1 vector, si-Foxo1 or si NC (e), in Min6 cells treatment with 0.5 mM palmitate or without palmitate (f), and in obese mice islets or normal mice islets (g), n = 5). Foxo1 could directly bind to miR-802 promoter in Min6 cells (h) and islets (i), n = 5) through EMSA assays. C1 and C2 represented nuclear-protein-miR-802 probe complexes, nuclear-protein-miR-802 probe-anti-Foxo1 complexes, respectively. Biotin-WT was a 25 bp fragment probe which included the binding region of Foxo1, while Biotin-MUT was a 25 bp fragment probe and the binding sequence was mutated. j Min6 cells were incubated with 0.5 mM palmitate and co-transfected with si-Foxo1, followed by qRT-PCR to examine the expression levels of miR-802. k qRT-PCR was performed to measure the miR-802 expression levels in lentivirus-shFoxo1-treated mice compared with control (white adipose tissue (WAT), brown adipose tissue (BAT), n = 5). l miR-802 expression after intravenous injection of HFD-fed mice with lentivirus-shFoxo1 (n = 5). All experiments above were performed in triplicates, and each group contained three batches of individual samples. The p-values by two-tailed unpaired Student’s t test (a–c, f and l), one-way ANOVA d, e, g and j or two-way ANOVA k are indicated. Data represent the mean ± SD. Source data are provided as a Source Data file.

