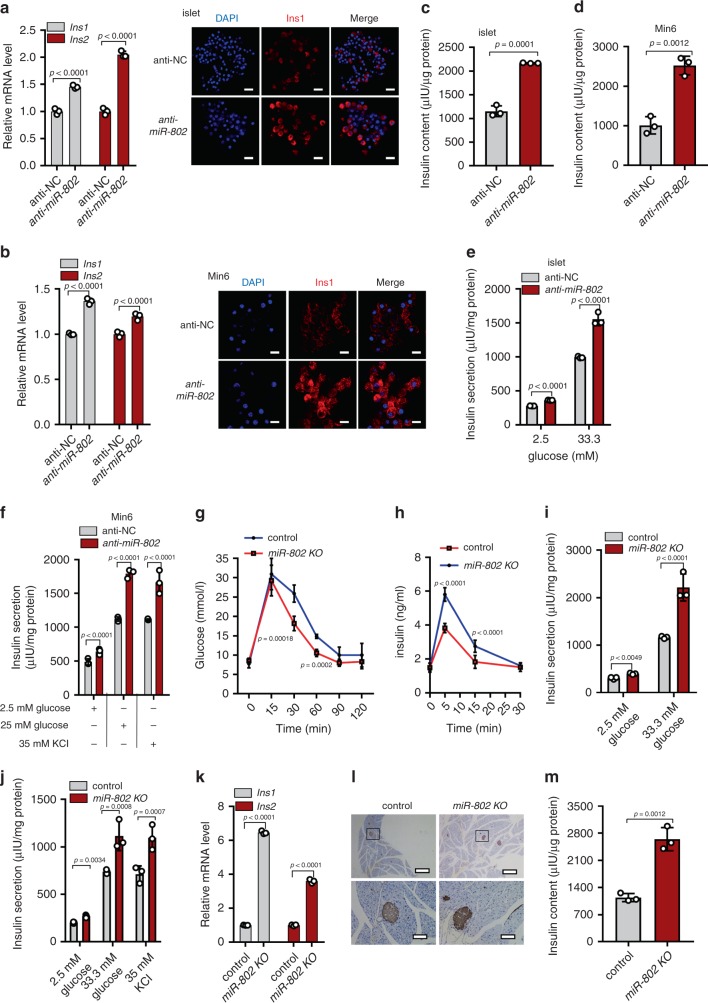
Fig. 4. Genetic deletion of miR-802 results in increased insulin content and secretion.
anti-miR-802 was transfected into primary islets and Min6 cells for 48 h. Then, qRT-PCR and immunostaining for DAPI (blue) and insulin (red) were performed (Magnification: ×40, scale bar: 20 μm) in islets (a), n = 3, 8 weeks old) and Min6 cells (b), n = 3 cell wells), and insulin content was evaluated in islets (c), n = 5, 8 weeks old) and Min6 cells (d), n = 3 cell wells). Insulin secretion was analyzed by GSIS assay in islets (e), n = 5, 8 weeks old) and Min6 cells (f), n = 3 cell wells). g IPGTT (2 g kg−1) in overnight fasted miR-802 KO and control mice at 10 weeks of age (n = 4). h In vivo insulin excursions in overnight fasted miR-802 KO and controls at 35 weeks of age after IPGTT exposure (n = 7). i, j Static insulin secretion performed with islets from 5- (i) and 35-week-old (j) miR-802 KO and control mice (n = 5) at indicated glucose and 35 mM KCl concentrations. k Relative Ins1 and Ins2 expression levels in vivo (n = 5). l Pancreatic sections were immunohistochemically stained for insulin. Magnification: ×4 and ×20, Scale bars: 200 and 20 μm (n = 3, 10-week old). m Insulin content in in vivo (n = 5, 8 weeks old). The p-values by two-tailed unpaired Student’s t test (c, d, m), or two-way ANOVA (a, b, e–k) are indicated. All data are represented as mean ± SD, except (g, h) (mean ± SEM). Source data are provided as a Source Data file.

