Table 2.
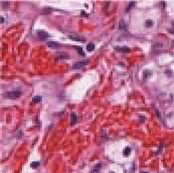
Illustrations of the 10 nucleus-level features.
| Feature name | Interpretation | Patch with small value | Patch with large value |
|---|---|---|---|
| Area | Size of nucleus (unit: pixel) |
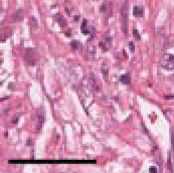 322 322 |
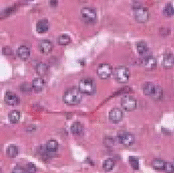 545 545 |
| Major | Major axis length (unit: pixel) |
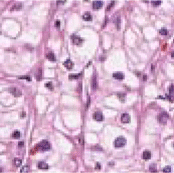 26 26 |
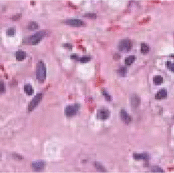 30 30 |
| Minor | Minor axis length (unit: pixel) |
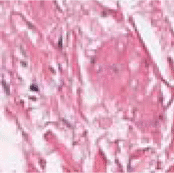 14 14 |
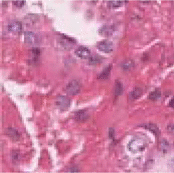 20 20 |
| Ratio | Major to minor ratio |
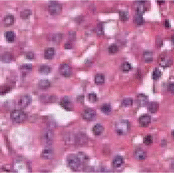 1.4 1.4 |
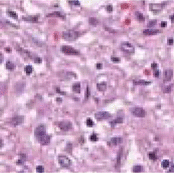 1.7 1.7 |
| rMean | Mean pixel value in R channel |
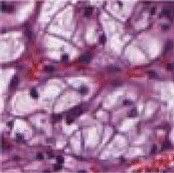 99 99 |
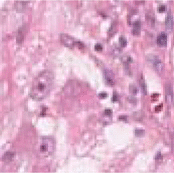 169 169 |
| gMean | Mean pixel value in G channel |
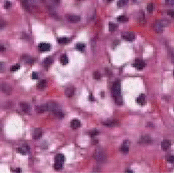 55 55 |
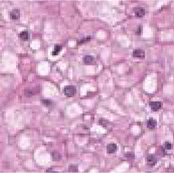 108 108 |
| bMean | Mean pixel value in B channel |
 102 102 |
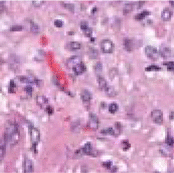 153 153 |
| distMean | Mean distance to neighbors (unit: pixel) |
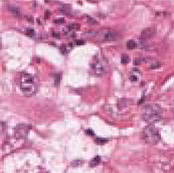 60 60 |
 95 95 |
| distMax | Maximal distance to neighbors (unit: pixel) |
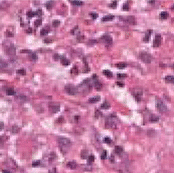 86 86 |
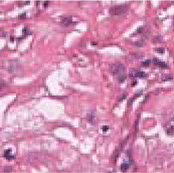 123 123 |
| distMin | Minimal distance to neighbors (unit: pixel) |
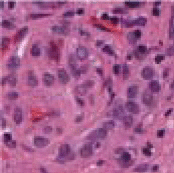 31 31 |
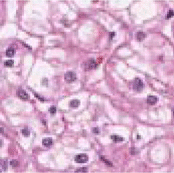 41 41 |
The number beside each image patch is the mean feature value for all nuclei in the patch. For example, the number 322 means the mean area of the nuclei in the patch is 322 pixels. Scale bar: 50 µm for all patches.
