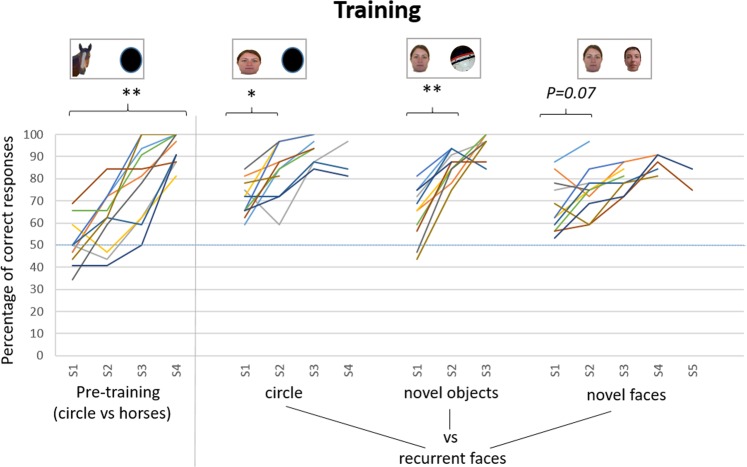
Figure 1.
Individual learning curves for the different training stages. S1 to S5: session 1 to 5 (32 trials per session).  : Recurrent faces (the same four different faces were always used).
  : Novel objects (different for each trial).
  : Novel faces (different for each trial). The statistical values indicated correspond to comparisons of the percentage of correct responses between sessions, when carried out by all the subjects (N = 11): Friedman test for the pre-training or Wilcoxon tests for the other stages of training. **P < 0.01; *P < 0.05.

