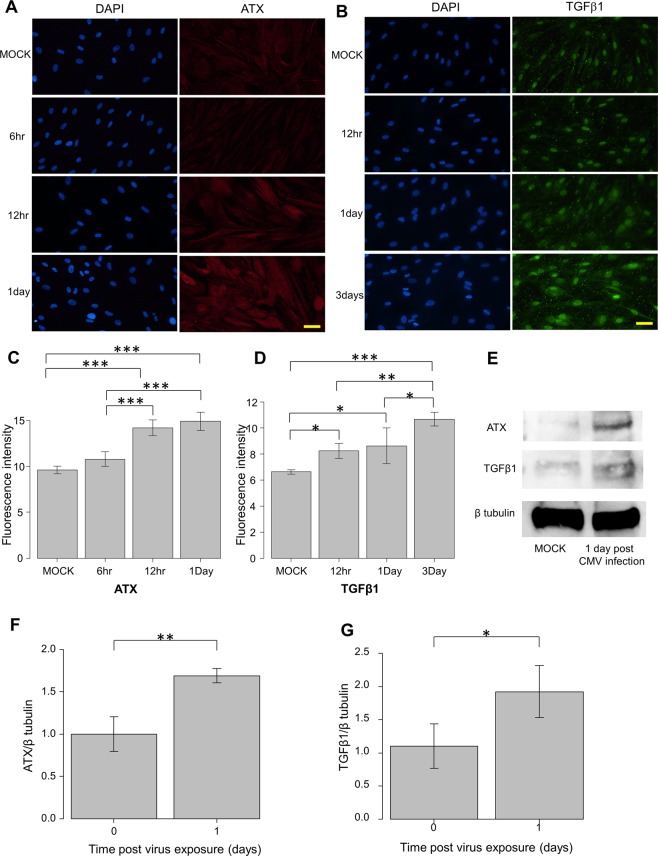
Figure 2.
Immunocytochemistry and western blotting of ATX and TGF-β1 in CMV-infected hTMs. (A,B) Immunocytochemistry of ATX and TGF-β1 in CMV-infected hTMs. The left panels show cells that were stained with DAPI. The right panels show cells stained for ATX (A) or TGF-β1 (B). The right panels show the merged image. For ATX images (A), the expression in the control is shown in the first row, followed by 6, 12, and 24 h post-infection. For the TGF-β1 images (B), the control is shown in the first row, followed by 12, 24, and 72 h post-infection. The expression of both ATX and TGF-β1 increased post-infection, and the expression increased over time. Bar, 200 μm. (C,D) Quantitative results based on immunocytochemistry. Four images of each experiments were taken and the fluorescence intensities were quantified. Data were presented as the mean ± standard deviation. *P < 0.05, **P < 0.01, ***P < 0.001. (E–G) Western blotting of ATX and TGF-β1 in CMV-infected hTMs. The representative bands for ATX and TGF-β1 are shown in (C), and the relative expression of ATX (D) and TGF-β1 (E) compared to the loading control (β-tubulin) are shown (n = 3). The grouping of gels/blots cropped from different parts of the same gel. *P < 0.05, **P < 0.01.

