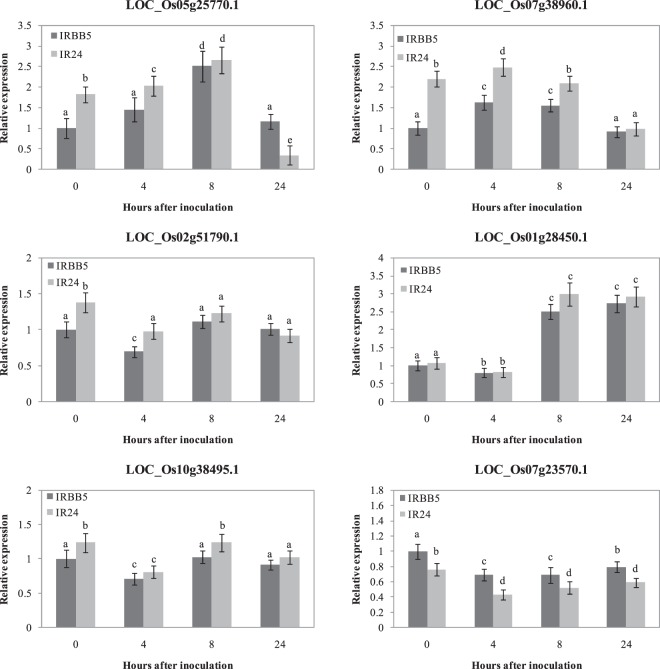
Figure 8.
Expression analysis of OsWRKY45 and SA-responsive genes, including OsNPR1-dependent and OsWRKY45-dependent, in IRBB5 and IR24. Transcript levels were determined by quantitative real-time RT-PCR. Values were normalized to the expression of each gene in IRBB5 that was not treated with Xoo. The rice actin gene was used as the internal control. Bars represent the average ± SD of three biological replicates. Different letters above columns indicate significant differences at P < 0.05 as determined by a one-way ANOVA followed by post hoc Tukey honest significant difference (HSD) analysis.

