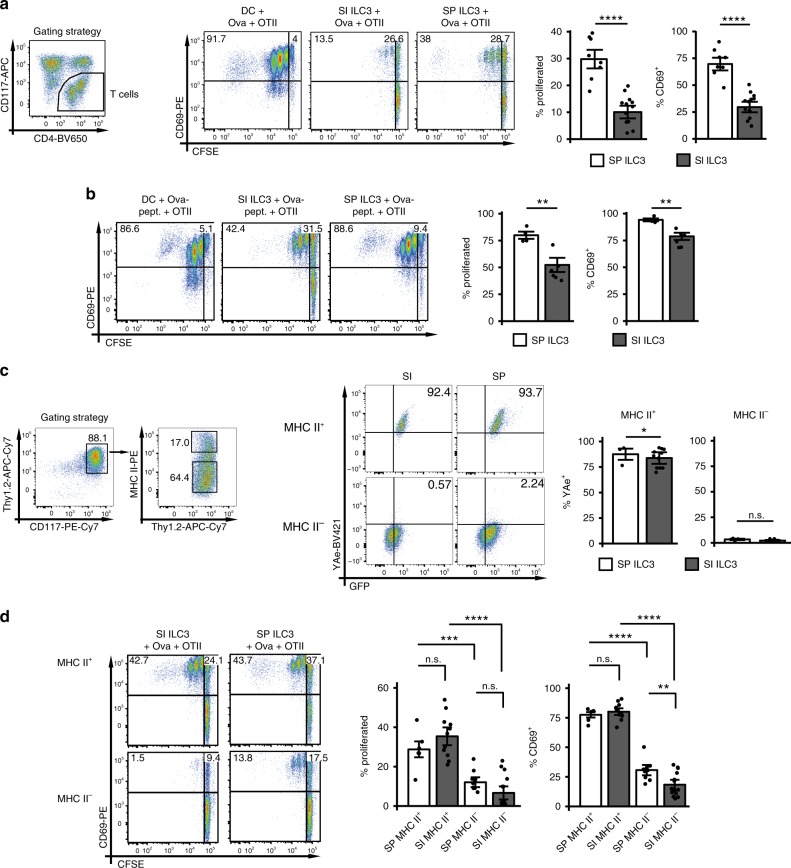
Fig. 2. SP and SI NCR− ILC3s differ in their capacity to stimulate CD4+ T cells.
Naive CFSE-labeled OT-IItg CD4+ T cells were cultured either with 5 × 10⁴ BMDCs, SP or SI ILC3s (Rag2−/−) pre-activated with IL-1β, in the presence of Ova protein (a) or peptide (b) for 72 h. ILC3s were sorted as depicted in Supplementary Fig. 2a. T cells were gated as CD3+ or CD117−. In (a), n = 8 (SP) and n = 13 (SI) distinct samples. Six independent experiments. In (b), n = 4 (SP) and n = 6 (SI) distinct samples. Three independent experiments. c SP or SI ILC3s (Rag2−/−) were cultured with Eα-GFP protein for 72 h. ILC3s were sorted as depicted in Supplementary Fig. 2a. Surface presentation of Eα peptide was analyzed by flow cytometry with antibody clone YAe. ILC3s were gated either on MHC II+ or MHC II−CD117+Thy1.2+ cells (gating strategy is depicted for SI ILC3s). n = 3 (SP) and n = 11 (SI) distinct samples of three independent experiments. d MHC II+ (n = 6 (SP) and n = 11 (SI) distinct samples) and MHC II− (n = 10 (SP) and n = 15 (SI) distinct samples) ILC3s from SP and SI (Rag2−/−) were stimulated with IL-1β and used for T-cell stimulation in the presence of Ova protein. Five independent experiments. ILC3s were sorted as depicted in Supplementary Fig. 2a, e. T cells were gated as CD3+ or CD117−. Each symbol represents a sample and the bar graph represents the mean ± s.e.m. n.s., not significant; *P ≤ 0.05; **P ≤ 0.01; ***P ≤ 0.001; ****P ≤ 0.0001, calculated with mixed-effects models (two-sided) using lmerTest. Source data are provided as a Source Data File.

