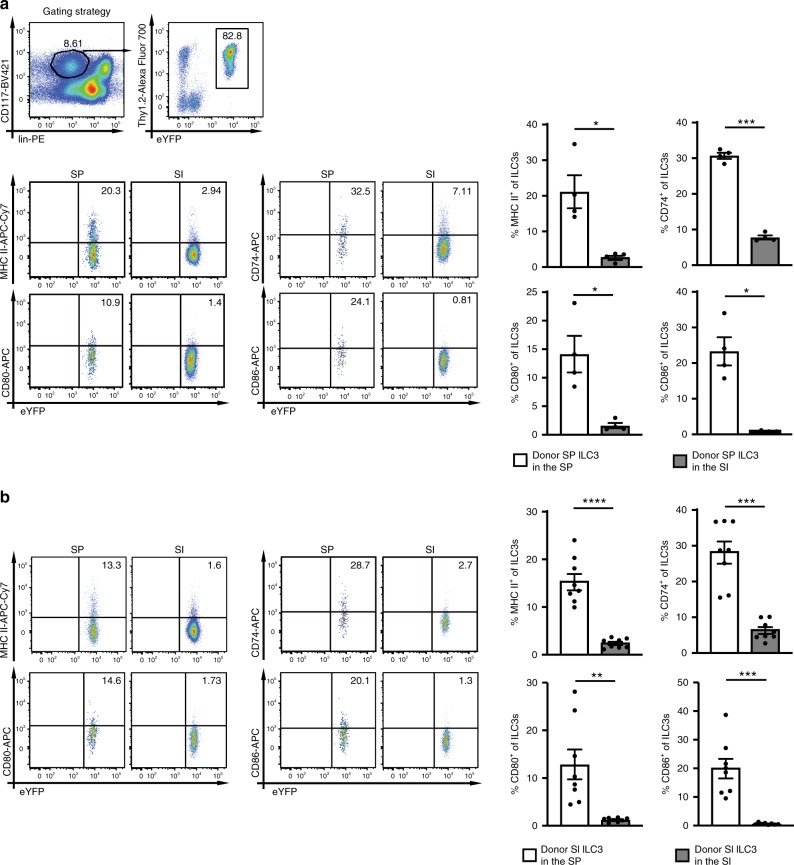
Fig. 3. The tissue localization determines the frequency of ILC3s with an APC phenotype.
SP ILC3s (a) or SI ILC3s (b) from Rorγtfm+Rag2−/− mice were i.v. injected into Rag2−/−Il2rg−/− mice. Cells were sort-purified as depicted in Supplementary Fig. 1a. Five weeks after transfer the expression of MHC II, CD80, CD86, and CD74 on donor derived ILC3s in the SP and SI of recipient mice was analyzed. ILC3s were gated as depicted in (a). a n = 4 distinct samples of four independent experiments and b n = 8 distinct samples of five independent experiments. Each symbol represents a sample and the bar graph represents the mean ± s.e.m. *P ≤ 0.05; **P ≤ 0.01; ***P ≤ 0.001; ****P ≤ 0.0001, calculated with two-tailed paired Student’s t test. Source data are provided as a Source Data File.

