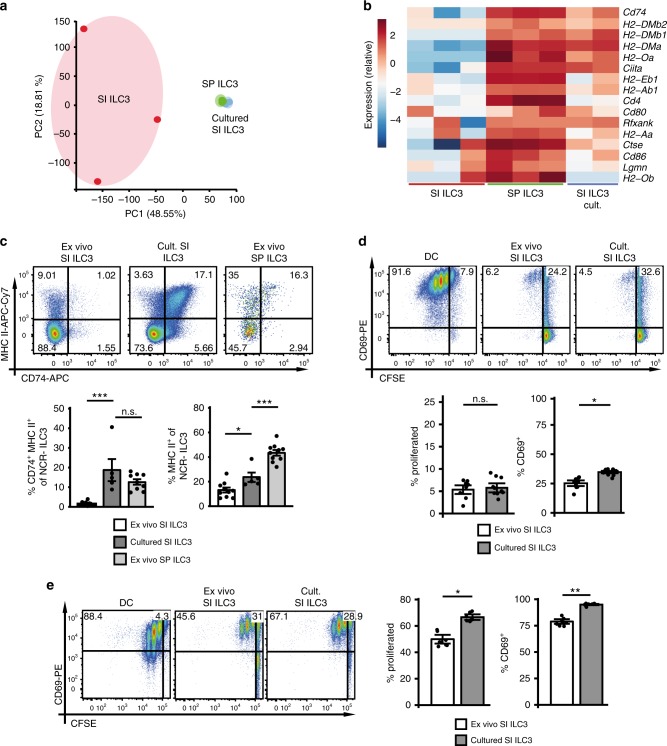
Fig. 4. MHC II downregulation of SI ILC3s is reversible upon in vitro culture.
CD117+Thy1.2+lin− (CD3ε, CD8α, CD11b, CD11c, CD19, B220, Gr-1, TCR-β, TCR-γ/δ, TER119, NK1.1) KLRG1− ILC3s were isolated from SP or SI of Rag2−/− mice (Supplementary Fig. 2a). Freshly isolated (ex vivo) SP (green) or SI ILC3s (red) and SI ILC3s cultured for 7 days with IL-2, IL-7, and SCF (blue) were used for RNA sequencing. a PCA of RNA sequencing samples. b Heatmap of genes associated with MHC II Ag presentation. c Expression of MHC II and CD74 by cultured ILC3s (n = 5 distinct samples) or ex vivo SI (n = 9–10 distinct samples) and SP (n = 9–10 distinct samples) ILC3s of Rag2−/− mice. Five independent experiments. d, e Naive CFSE-labeled OT-IItg CD4+ T cells were cultured either with 5 × 10⁴ BMDCs, ex vivo or cultured SI ILC3s from Rag2−/− mice in the presence of Ova protein (d) or peptide (e). In (d), n = 9 (ex vivo SI ILC3) and n = 10 (cultured SI ILC3) distinct samples of four independent experiments. In (e), n = 8 distinct samples of three independent experiments. T cells were gated as in Fig. 2. Each symbol represents a sample and the bar graph represents the mean ± .e.m. n.s., not significant; *P ≤ 0.05; **P ≤ 0.01; ***P ≤ 0.001, calculated with one-way ANOVA (two-tailed) and Bonferroni’s multiple comparisons test (c) or with mixed-effects models (two-sided) using lmerTest (d and e). Source data are provided as a Source Data File.

