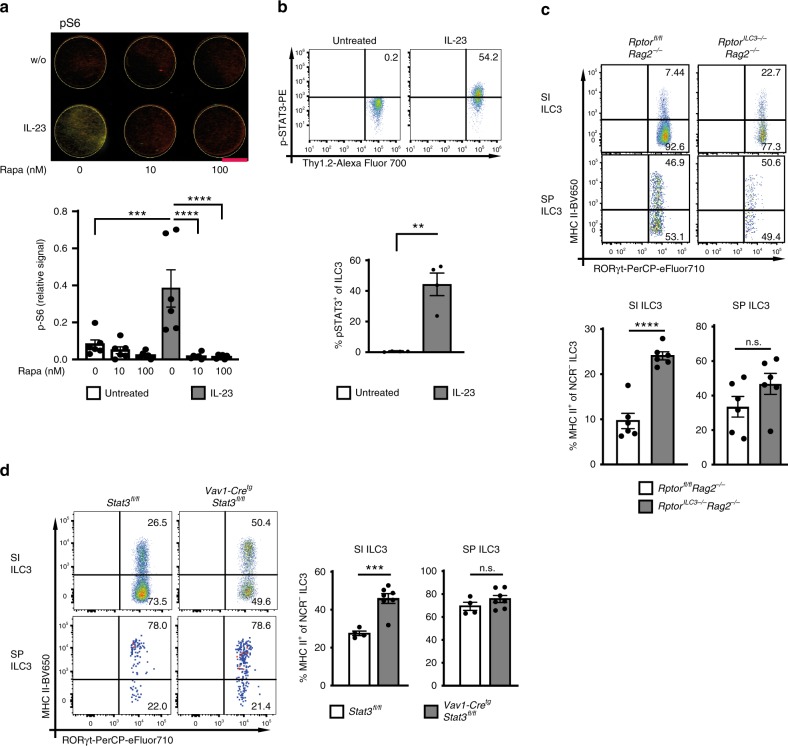
Fig. 6. IL-23 reduces MHC II expression through activation of mTORC1 and STAT3.
a Phosphorylation of S6 of SI ILC3s (sorted from Flt3Ltg mice) after 48 h stimulation with or without IL-23 and 0, 10, or 100 nM Rapamycin (red = tubulin and green = p-S6). ILC3s were sorted as depicted in Supplementary Fig. 2a. Indicated is the relative phosphorylation of S6 (fluorescence signal for p-S6 normalized by fluorescence signal for tubulin). The indicated bar represents 3 mm. n = 6 distinct samples of five independent experiments. b Phosphorylation of STAT3(Tyr705) of sort-purified SI ILC3s (Supplementary Fig. 2a) from Rag2−/− mice after 20 min stimulation with or without IL-23. n = 4 distinct samples of four independent experiments. c MHC II expression of SI and SP ILC3s from Rptorfl/flRag2−/− and RptorILC3−/−Rag2−/− mice. NCR− ILC3s were gated as shown in Fig. 1. n = 6 mice of two independent experiments. d MHC II expression of SI and SP ILC3s from Stat3fl/fl (n = 4 mice) and Vav1-CretgStat3fl/fl (n = 7 mice) mice. NCR− ILC3s were gated as shown in Fig. 1. Two independent experiments. Each symbol represents a sample and the bar graph represents the mean ± s.e.m. n.s. not significant; **P ≤ 0.01; ***P ≤ 0.001; ****P ≤ 0.0001, calculated with one-way ANOVA (two-tailed) and Bonferroni’s multiple comparisons test (a) or two-tailed paired (b) or two-tailed unpaired (c and d) Student’s t test. Source data are provided as a Source Data File.

