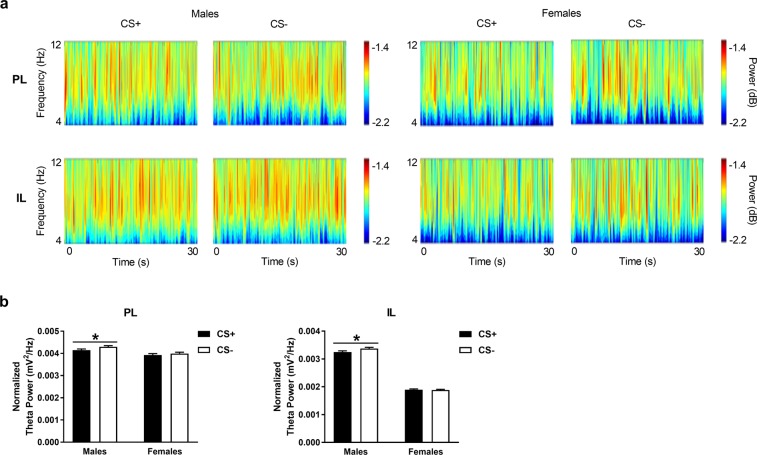
Figure 4.
Theta power in PL and IL during CS+ and CS− presentation during retrieval in males and females. (A) Wavelet periodograms showing theta (4–12 Hz) power, which is represented by different colors in the adjacent scale bars (dark blue: low power, red: high power), over time during the CS+ and CS−. No obvious qualitative differences in theta power were apparent between the CS+ and CS− in PL (top) or IL (bottom) in males (left) or females (right). (B) In males, theta power averaged over the frequency range and cue duration was significantly increased in response to the CS−, compared to the CS+, in PL and IL (*P < 0.05), whereas there were no differences in theta power between the two cues in females.

