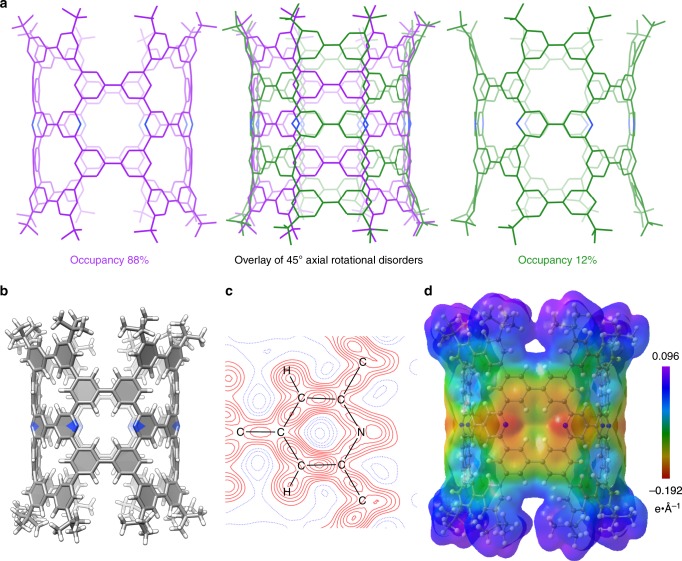
Fig. 3. Crystal structures of (12,12)-NpNT.
a Molecular structures of two disordered structures. b Molecular structure (occupancy = 88%). c Deformation map (contour interval: 0.02 e Å−3, positive: red, negative: blue). Note that, because of the lower occupancy of 12%, negligible densities of the minor disordered structure were found in the electron and deformation density map, which also resulted in distortions of the assigned structures. See also Fig. 3a and Supplementary Fig. 5. d Electrostatic potential map mapped on the 0.0067 e Å−3 isosurface of the electron density.

