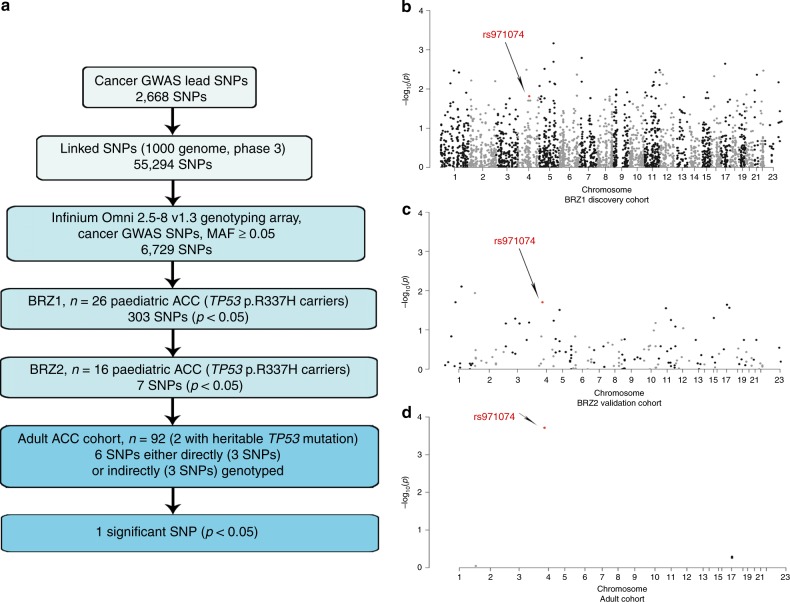
Fig. 1. Cancer GWAS approach to identify the genetic modifiers in ACC age-of-onset.
a A flow chart representing the focused analytical approach taken to identify potential cancer GWAS SNPs which associate with differential age of ACC onset. b–d Manhattan plot representing cancer GWAS SNPs tested in BRZ1 (discovery) cohort with p-value represented in −log10(p) for each SNP (n = 6059) (b). Manhattan plot representing the significant cancer GWAS SNPs (p < 0.05) in BRZ1 and their validation in the BRZ2 cohort (n = 282, out of 303 significant in BRZ1) (c). Manhattan plot representing significant the cancer GWAS SNPs in both BRZ1 and BRZ2 and validated in the adult ACC cohort (n = 6, out of 7 significant in BRZ1 and BRZ2) (d). The significant SNP in the 3 cohorts is marked in red and pointed with an arrow.

