
Fig. 2. Deletion analysis of the ES2 lncRNA.
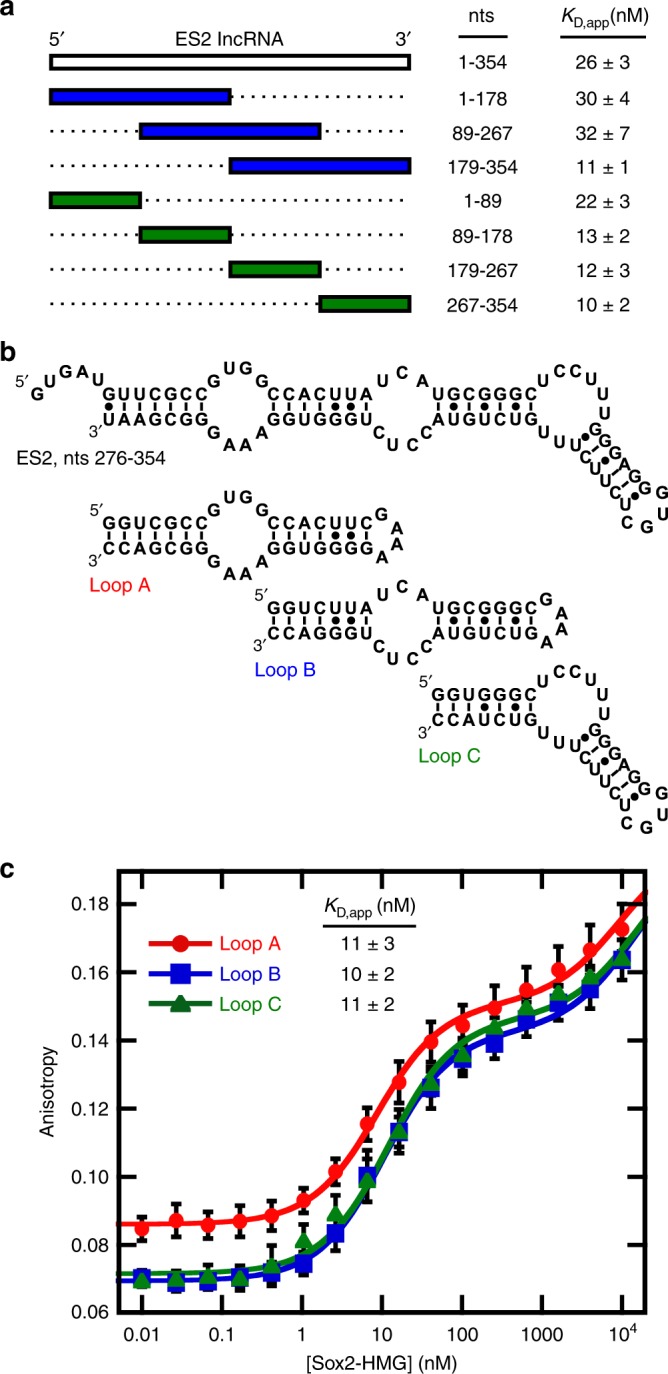
a Schematized depiction of the ES2 lncRNA and the segmented transcripts. Apparent binding affinity displayed as the average and s.e.m. of n = 6 technical replicates excluding 1–354 ES2, which is n = 10 technical replicates). b Sfold44 predicted secondary structure of ES2, nts 276–354, and minimized loop constructs. c Average binding curve for each Sox2-RNA interaction with error bars displaying the standard deviation of each measurements. KD,app is reported for the first transition and presented as the average and the s.e.m. of n = 6 technical replicates.