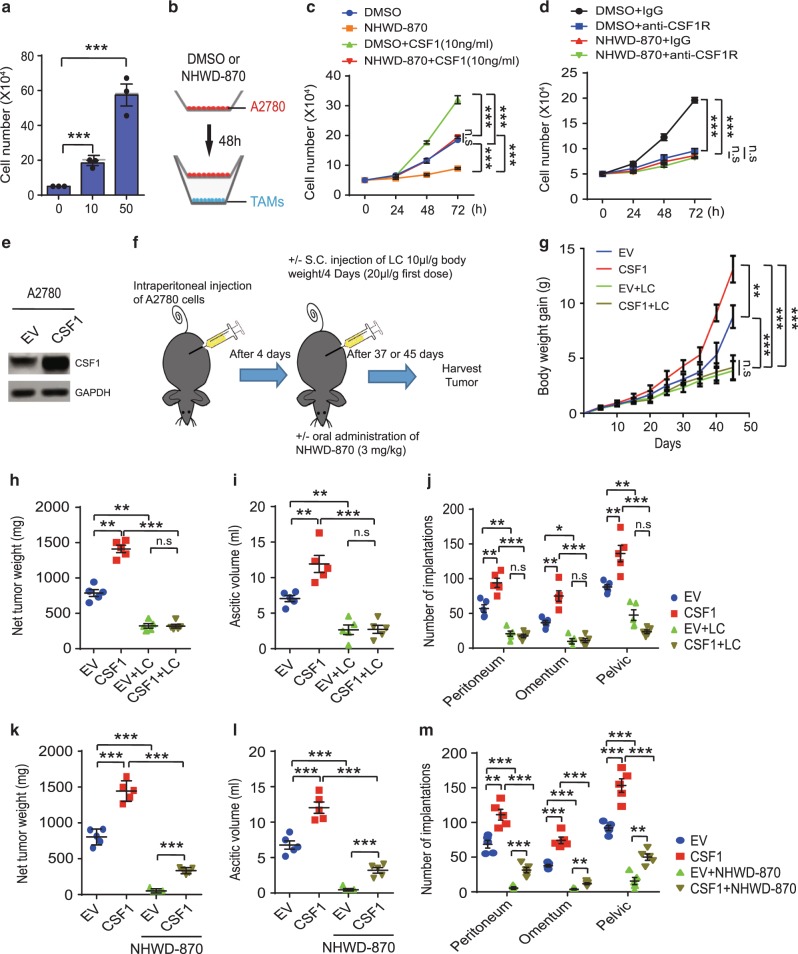
Fig. 6. CSF1/CSF1R signaling is critical for the tumor inhibitory effects of NHWD-870 and CSF1 induced ovarian cancer growth depends on macrophages.
a Number of TAMs after treatment with the indicated concentration of CSF1 for 48 h. Data are presented as mean ± SEM from three independent experiments. b–d Schematics of the experiments (b). A2780 cells (pre-treated with DMSO or 100 nM NHWD-870 for 48 h) were seeded into the top chamber (transwell size: 0.4 μm), and TAMs (Mac, 40,000 cells per 24-well) in medium with PBS or 10 ng/ml CSF1 (c), or 50 ng/ml IgG or anti-CSF1R antibodies (d), were seeded into the bottom chamber. Shown are quantification of TAMs (c, d). Data are presented as mean ± SEM from three independent experiments. e Representative western blot analysis of A2780 cells stably transfected with CSF1 or empty vector (EV). Selected from three independent experiments. f Schematics of the animal experiments using an orthotopic mouse OC model, established by intraperitoneally injecting 1 × 10⁶ (g–j) or 2 × 10⁶ (k–m) human A2780 cells overexpressing CSF1 or control into female recipient nude mice. Mice were then treated with/without liposomal clodronate (LC) for 45 days (g–j) or treated with/without NHWD-870 (PO, QD, 3 mg/kg) for 37 days (k–m). g Increased mouse body weight was measured at the indicated time points (day 0-45 after LC treatment). h–j Net tumor weight (h), ascitic fluid volumes (i) tumor implantations in peritoneum, omentum and pevic cavity (j) were measured at day 45 from LC treatment. k–m Net tumor weight (k), ascitic fluid volumes (l) tumor implantations in peritoneum, omentum and pevic cavity (m) were measured at day 37 after NHWD-870 treatment. For g–m, data are presented as mean ± SEM from five different mice. p values were calculated using two-tailed, unpaired t tests in this figure. n.s, not significant; *p < 0.05; **p < 0.01; and ***p < 0.001. Source data are provided as a Source Data file.

