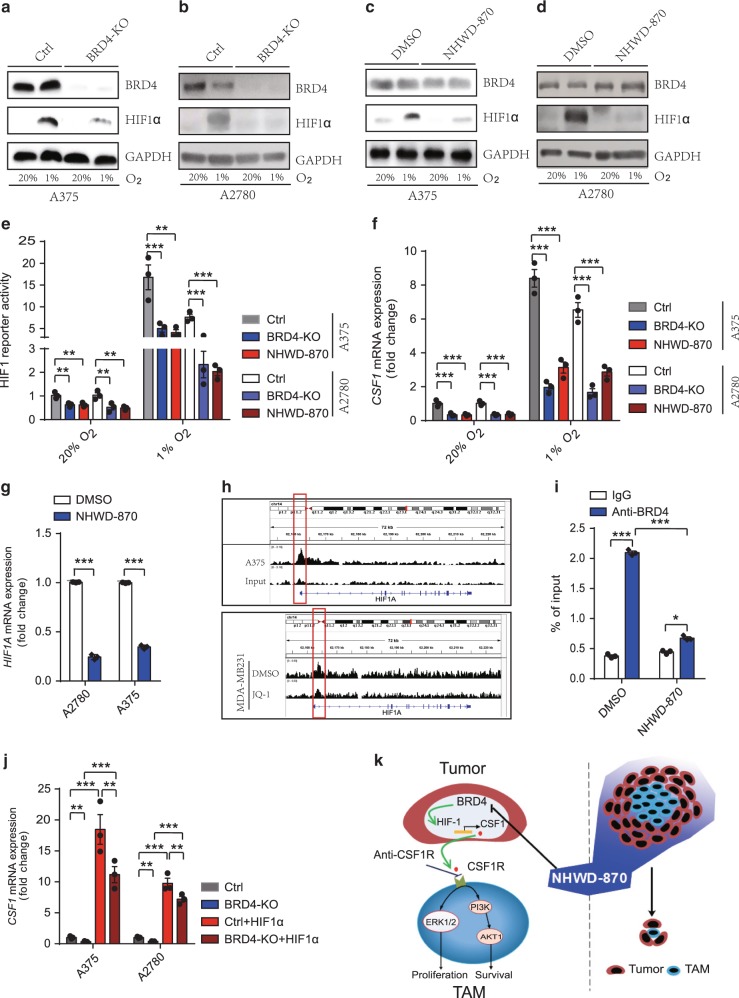
Fig. 7. NHWD-870 inhibited CSF1 expression through suppressing BRD4 and HIF1α in tumor cells.
a, b Representative western blot analysis of control (Ctrl) and BRD4 knockout (KO) A375 and A2780 cells exposed to 20% or 1% O2 for 24 hours. Selected from three independent experiments. c, d Representative western blot analysis of A375 and A2780 cells treated with DMSO or 25 nM NHWD-870 and exposed to 20% or 1% O2 for 24 h. Selected from three independent experiments. e Relative HIF1 luciferase reporter activity in control (Ctrl), BRD4 knockout (KO), or NHWD-870 treated A375 and A2780 cells exposed to 20% or 1% O2 for 24 h. Data are presented as mean ± SEM from three independent experiments. f RT-qPCR analyses of CSF1 in control (Ctrl), BRD4 knockout (KO), or NHWD-870 treated A375 and A2780 cells exposed to 20% or 1% O2 for 24 hours. Data are presented as mean ± SEM from three independent experiments. g RT-qPCR analyses of HIF1A in A375 or A2780 cells treated with 15 nM NHWD-870 or DMSO control for 24 h. Data are presented as mean ± SEM from three independent experiments. h Genome browser view of BRD4 ChIP-seq peaks on the HIF1A promoter. Shown are BRD4 ChIP and input control of A375 cells (top panel) and BRD4 ChIP of MDA-MB231 cells treated with DMSO or JQ-1 (bottom panel). i BRD4 ChIP-qPCR analyses of the HIF1A promoter in A2780 cells treated with DMSO or NHWD-870 for 72 h. Data are presented as mean ± SEM from three independent experiments. j RT-qPCR analyses of CSF1 in A375 and A2780 cells were transiently transduced with HIF1α, then exposed to 1% O2 for 24 h. Ctrl, Control. Data are presented as mean ± SEM from three independent experiments. k A model showing the effects of NHWD-870 on cancer cell-TAM interaction. NHWD-870 inhibits the proliferation and survival of TAMs partly by inhibiting BRD4 activity, HIF1α expression, and CSF1 secretion by tumor cells, and downregulating CSF1R mediated ERK and PI3K/AKT signaling in TAMs. p values were calculated using two-tailed, unpaired t tests in this figure. *p < 0.05; **p < 0.01; ***p < 0.001. Source data are provided as a Source Data file.

