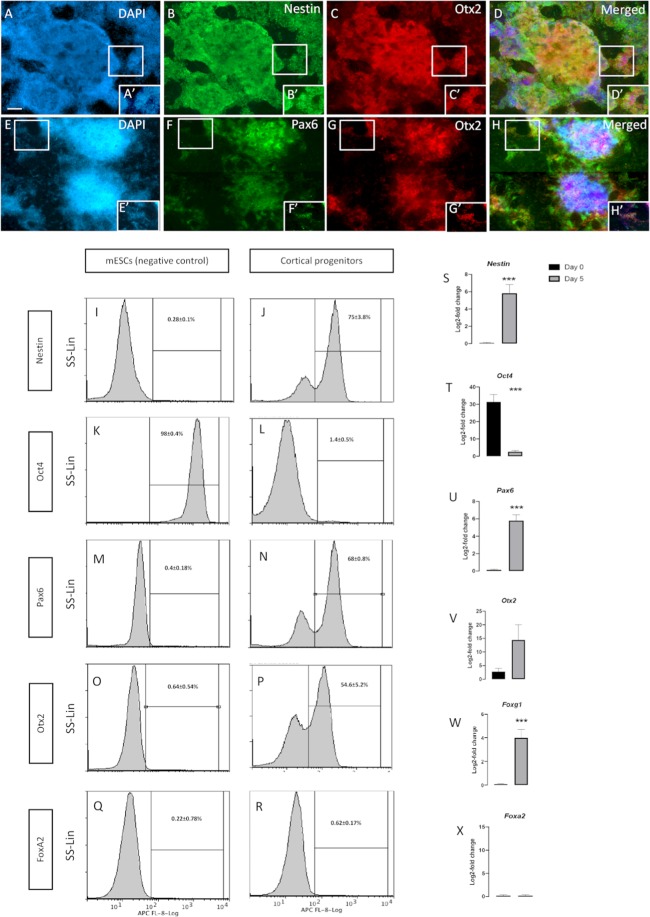
Figure 2.
The naïve mESCs differentiated into cortical progenitors in 5 days in monolayer culture. The tile and zoomed images show that the differentiated neural progenitors, labelled with (A,A′) DAPI, widely express the neural progenitor marker (B,B′) Nestin and the forebrain/midbrain marker (C,C′) Otx2. (D,D′) Merged images. The lower panel of the photomicrographs show that neural progenitors stained with (E,E′) DAPI, highly express the early cortical marker (F,F′) Pax6 and the forebrain/midbrain marker (G,G′) Otx2. (H,H′) Merged images. Flow cytometry comparative analysis between mESCs (control) and neural progenitors on day 5 depict (I,J) dramatic elevation in Nestin expression, (K,L) disappearance of Oct4, emergence of both (M,N) Otx2 and (O,P) Pax6 in cortical progenitors, all of which when compared to their negative counterparts. (Q,R) The null expression FoxA2 in both cortical progenitors and their negative matches. Log-2-fold change in the transcriptional expression of (S) Nestin, (T) Oct4, (U) Otx2, (V) Pax6, (W) Foxg1, and (X) FoxA1 supporting the findings obtained from the flow cytometry analyses. Data represents mean ± SEM, n = 5, Students t-test ***p < 0.001. Scale bars = 100 um.

