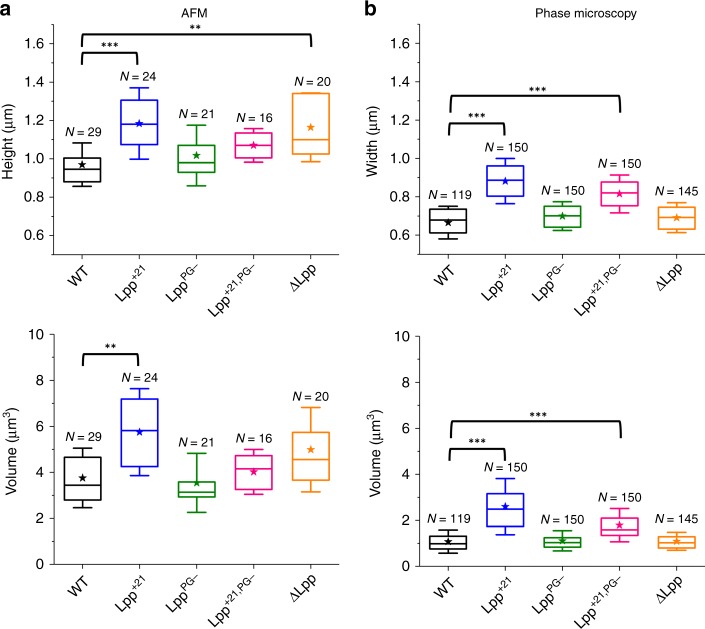
Fig. 3. Effect of Lpp mutations on E. coli dimensions.
Box plots reporting the height/width and volume of each bacterial strain estimated from (a) AFM images and (b) phase microscopy cliches. Shown here are the mean values (star), the median, the 25 and 75% quartiles (boxes), and the standard deviation (whiskers) obtained from N independent cells over at least three independent experiments. **P ≤ 0.001 and ***P ≤ 0.0001. Source data are provided as a Source Data file.

