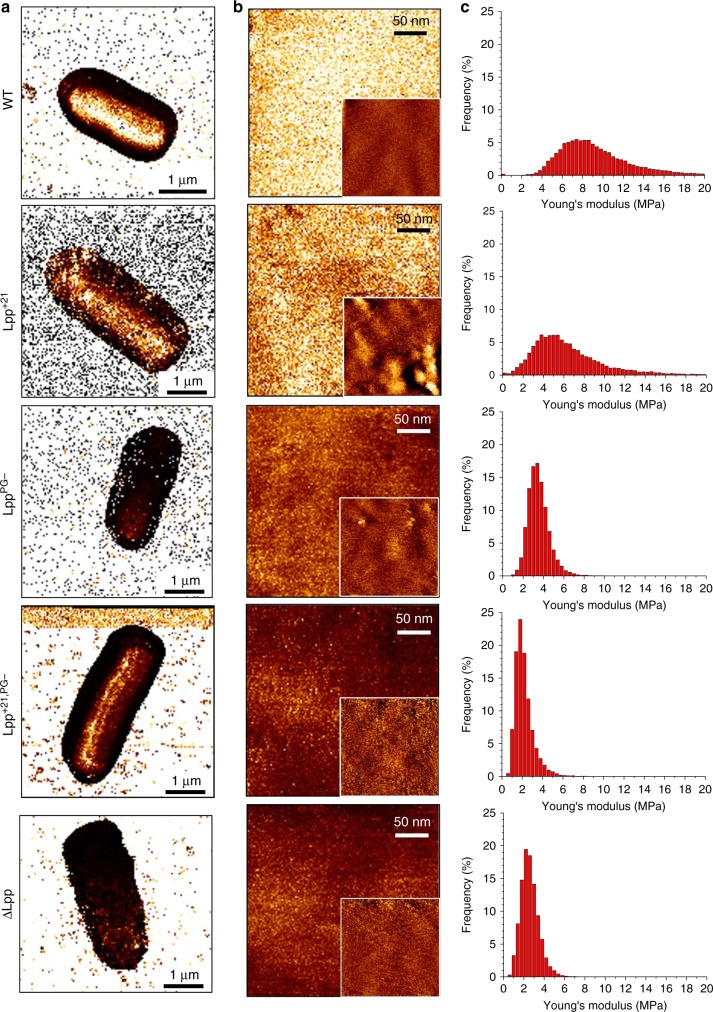
Fig. 4. Multiparametric imaging of E. coli WT and Lpp mutants.
a Elasticity maps in PBS of representative cells from the main E. coli strains (QI mode, 128 × 128 curves, color scale: 10 MPa). b High-resolution elasticity maps recorded on top of the cell (color scale: 10 MPa) along with corresponding height images (insets, color scale: 10 nm). c Distribution of Young’s modulus values corresponding to the elasticity maps in b. These images are representative of at least three independent experiments. Source data are provided as a Source Data file.

