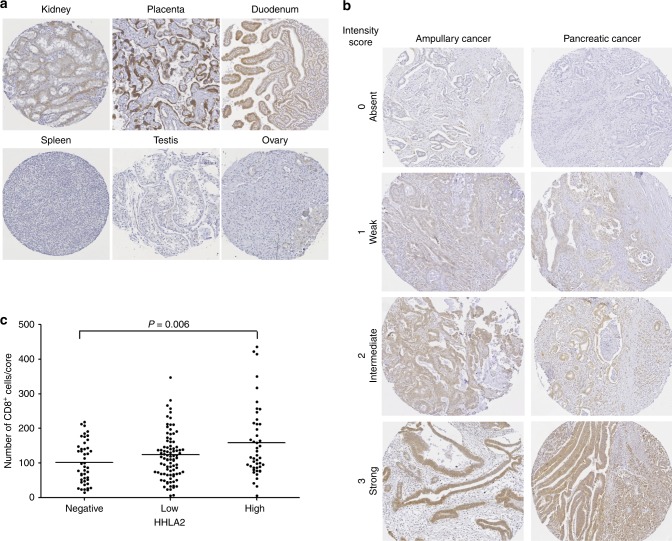
Fig. 1. HHLA2 expression in pancreatic cancer and ampullary cancer of the pancreato-biliary subtype.
a Immunohistochemical staining with anti-HHLA2 monoclonal antibody clone 566.1 shows HHLA2 expression on tubular epithelium of kidney, trophoblastic cells of placenta and duodenal epithelium, but no expression in healthy lung, spleen and ovary (magnification 28 × ). b Representative examples of the three different HHLA2 expression levels in ampullary cancer and pancreatic cancer (magnification 45 × ). c Numbers of tumour-infiltrating CD8+ T cells in tumours with different HHLA2 expression levels. Y-axis: Mean numbers of CD8+ T cells per core of tumour tissue, derived from CD8+ cell counts from five different tumour cores. Each case is depicted as a dot, and means are shown as horizontal lines.

