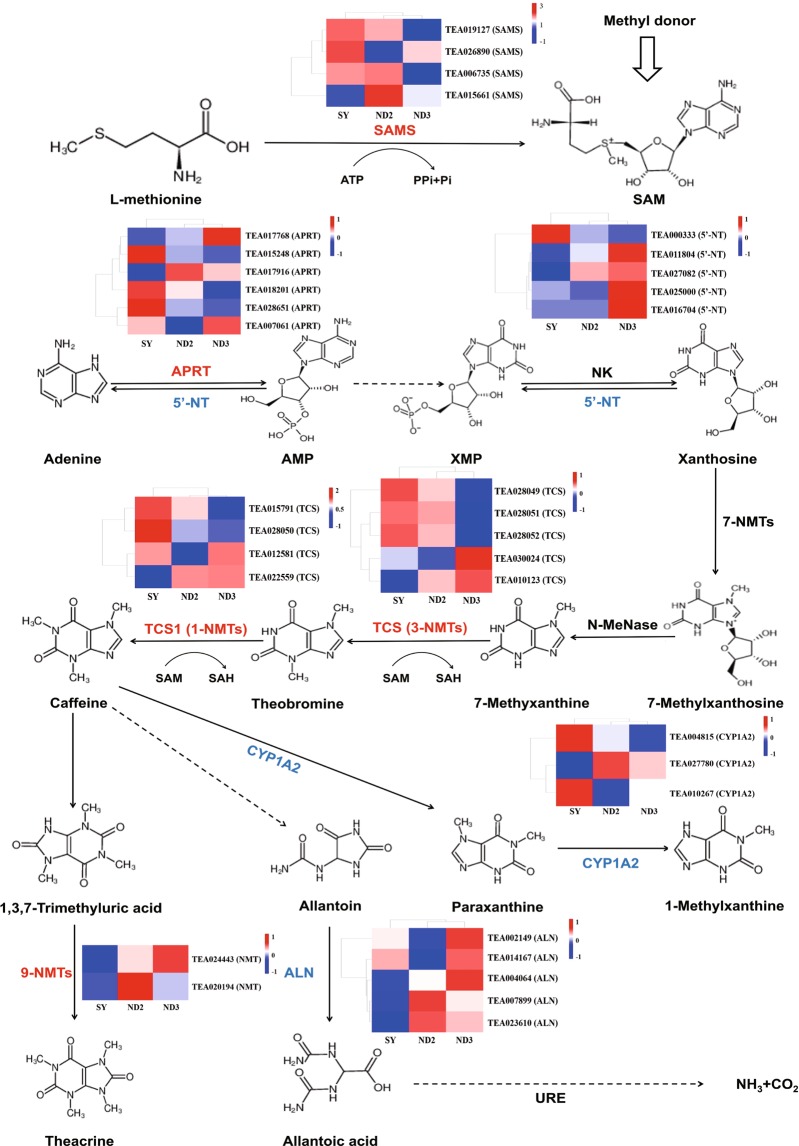
Figure 5.
Purine alkaloid metabolic pathway. Dotted line indicates that some metabolites have been omitted. The column chart shown that the gene expression of three tea samples. The red genes play a synthetic role and the blue represent degradation. *SAMS, S-adenosylmethionine synthetase, APRT, adenine phosphoribosyltransferase; NK, nucleoside kinase; 5′-NT, 5′-nucleotidase; 3-NMT and 1-NMT, tea caffeine synthase (TCS); N-MeNase, N-methyl nucleosidase; CYP1A2, cytochrome P450 family 1 subfamily apolypeptide 2; ALN, allantoinase; URE, urease.

