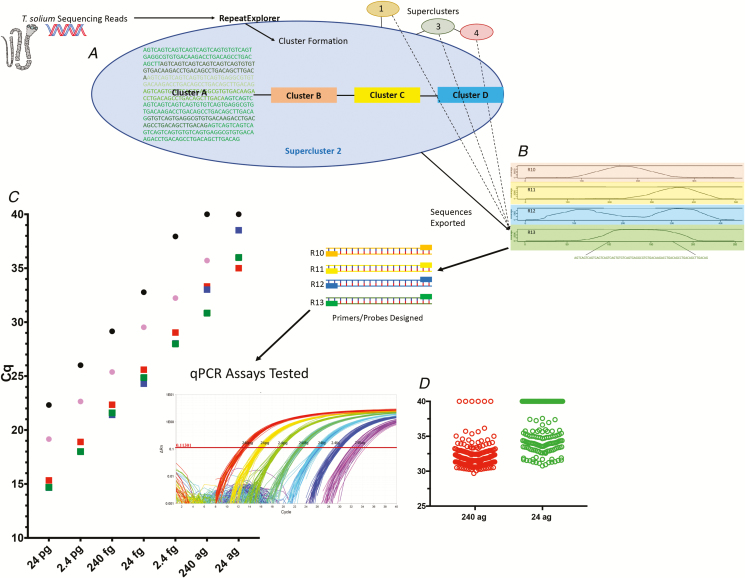
Figure 1.
Workflow of qPCR discovery and testing. A, Raw Taenia solium sequencing reads are clustered by similarity with RepeatExplorer, and result in outputs with variable repeat coverage. B, There are 4 representative, clustered contigs (contiguous segments of overlapping DNA) with greater than 1000x coverage and >70 base pairs shown, with the coverage across the genome on the y axes and the contours of the various nucleotides across the contigs on the x axes. Below the bottom contig (Tsol R13) is the sequence selected for qPCR assay development. C, Comparison of detection of genomic DNA at various concentrations (x axis), using qPCR, for TsolR11 (red squares), TsolR12 (blue squares [hidden underneath other squares in some cases]), TsolR13 (green squares), the ITS [16] (black circles), and pTsol9 [15] (pink circles), plotted as a function of Cq. The insert shows amplification plots of T. solium genomic DNA from 240 pg to 24 ag using Tsol13R run in replicates of 48 each. D, Limit of detection of TsolR13-based qPCR using 188 identical wells at inputs of 240 ag (red circles) and 24 ag (green circles). Abbreviations: ag, attograms; ITS, intergenic transcribed spacer; qPCR, quantitative polymerase chain reaction.

