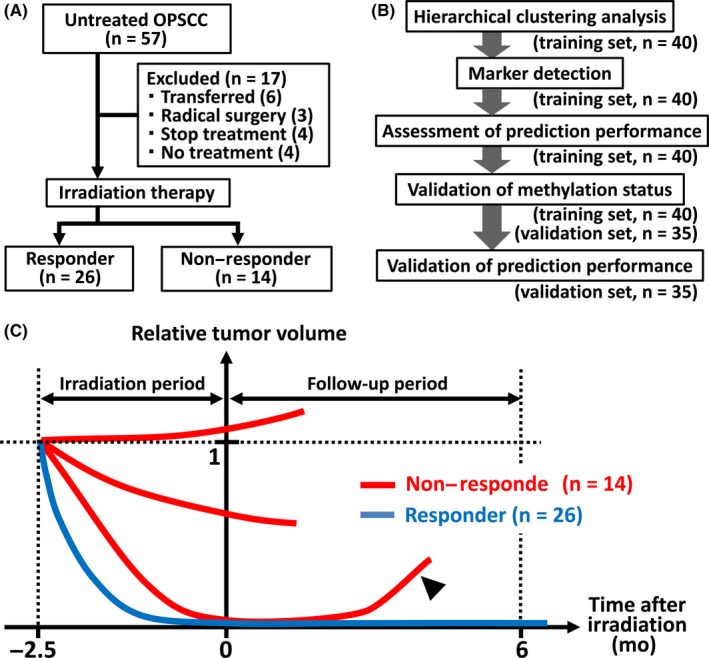
Figure 1.

Study participants and design. A, Diagram of participant inclusion and exclusion criteria in the training sample set (n = 40). B, Flowchart of the study. C, Overview of the definition of therapeutic efficacy. The vertical axis represents total tumor volume and the horizontal axis represents the time lapse from the end of the irradiation period. Red and blue lines, non–responder and responder cases, respectively. Arrowhead, relapse including local or locoregional relapse and distant metastasis
