Figure 5.

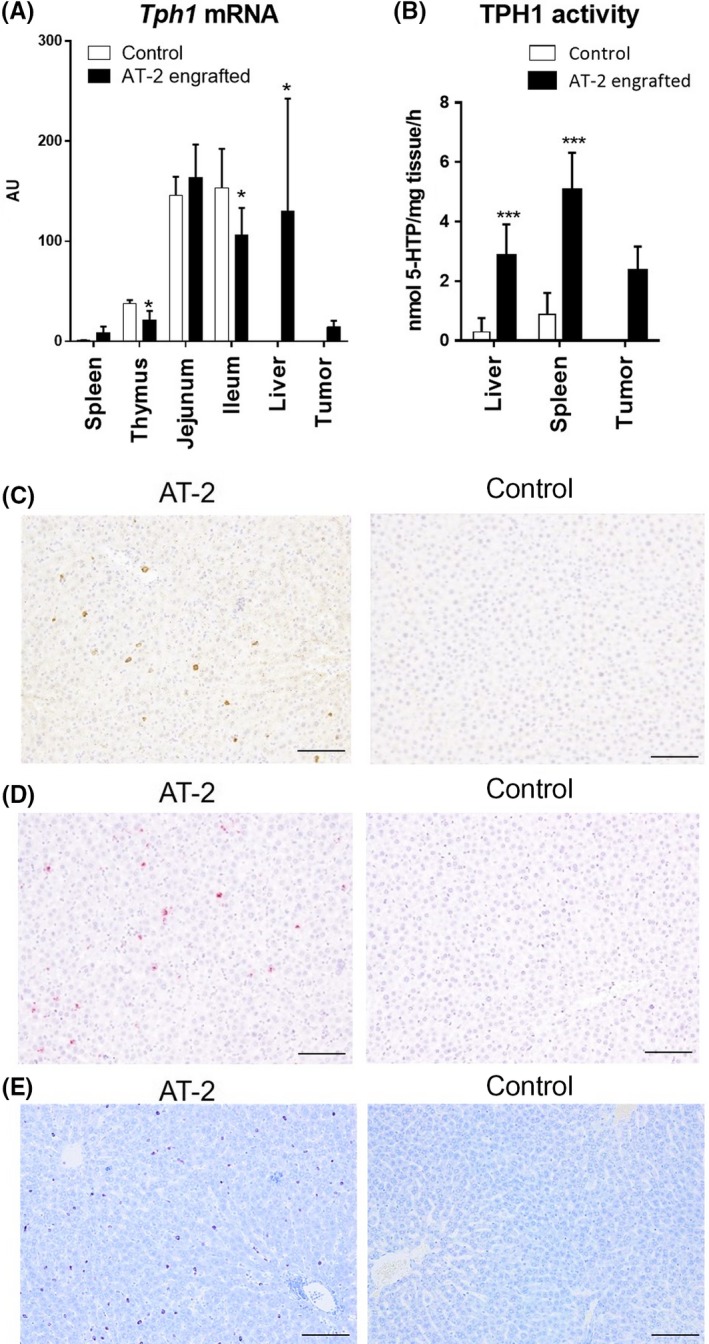
Tryptophan hydroxylase‐1 (TPH1) expression and activity are significantly increased in liver and spleen of AT‐2 engrafted rats. A, Tph1 mRNA levels in investigated tissues. Results were normalized to the level in spleen of control that showed lowest expression. Data are means ± SD (N = 6/group). *P < .05, **P < .01 vs control by Student’s t test. B, TPH1 activities in liver, spleen, and tumor. Data are means ± SD (N = 6/group). ***P < .001 vs control by Student’s t test. C, Representative images of immunohistochemical staining of TPH1 in livers of control and AT‐2 rats. Brown staining indicates TPH1 protein. D, Representative images of in situ hybridization of TPH1 in livers of control and AT‐2 rats. Red staining indicates TPH1 expression. E, Representative images of toluidine blue staining of livers of control and AT‐2 rats. Red purple staining indicates the presence of mast cells. Scale bar = 100 µm
