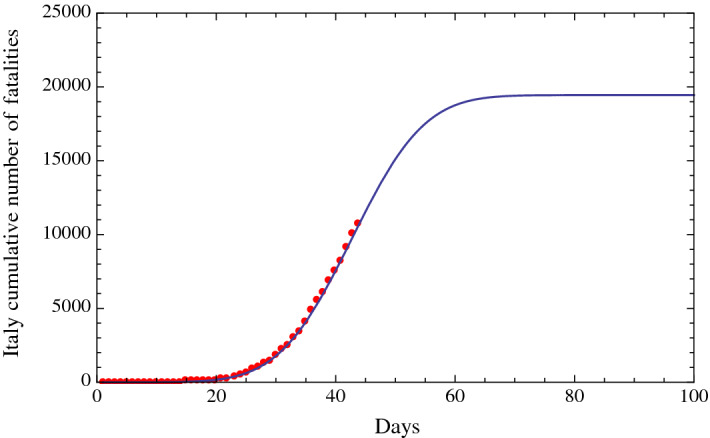
Fig. 4.

Fit of the cumulative number of fatalities due to COVID-19 in Italy (red dots) from February 15, 2020 (included), to March 29, 2020 (included), using a fitting function of the type of the Gauss error function with four parameters (solid line). The analysis of the curve shows that the date of the flex and the date of a substantial reduction in the number of fatalities are four days after the predictions based on the cumulative number of diagnosed positive cases of COVID-19 in Italy (Fig. 3), thus confirming the consistency of our results
