
Figure 5.
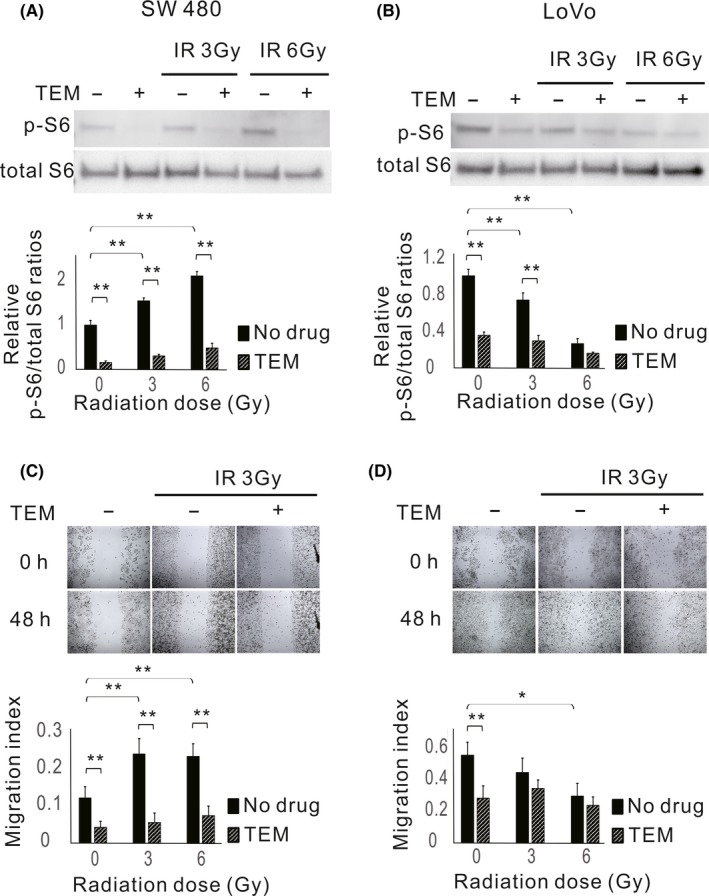
Expression levels of phosphorylated S6 ribosomal protein (p‐S6) and migration abilities in response to ionizing radiation (IR) in colorectal cancer cell lines. Cells were treated with or without 80 nmol/L temsirolimus (TEM) followed by 3 or 6 Gy radiotherapy and examined 24 h after radiotherapy. Western blot analysis of p‐S6 and total S6 expression in SW480 (A) and LoVo cells (B). Bar plots represent the relative expression levels of p‐S6 normalized to total S6 levels. The data are expressed as the mean ± SD. **P ˂ .01. Wounds in SW480 (C) and LoVo (D) cell monolayers at 0 and 48 h after scratching (×40 magnification). Bar blots represent the migration index of cells. The data are expressed as the mean ± SD. *P ˂ .05. **P ˂ .01