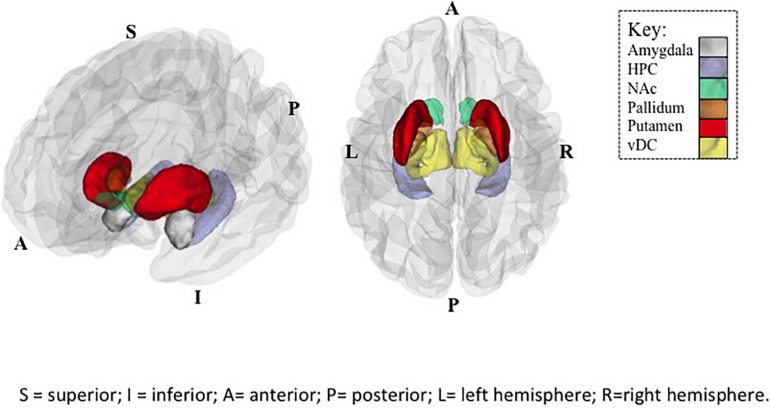
FIGURE 1.
Regions of Interest (ROIs) exhibiting significant SES × subcortical volumes associations in Controls. Plotted ROIs illustrate regions where positive associations between SES and brain volumes in Controls (corrected p values <0.05), but not youth with PAE (n.s.) were observed in post hoc analyses. Regions with significant group differences in SES-volume associations include the nucleus accumbens (NAc), hippocampus (HPC), and ventral diencephalon (vDC). Image on left provides a side view, and image on right provides a top view of ROIs. Abbreviations: A = anterior; P = posterior; S = superior; I = inferior; L = left hemisphere; R = right hemisphere.

