Figure 1.

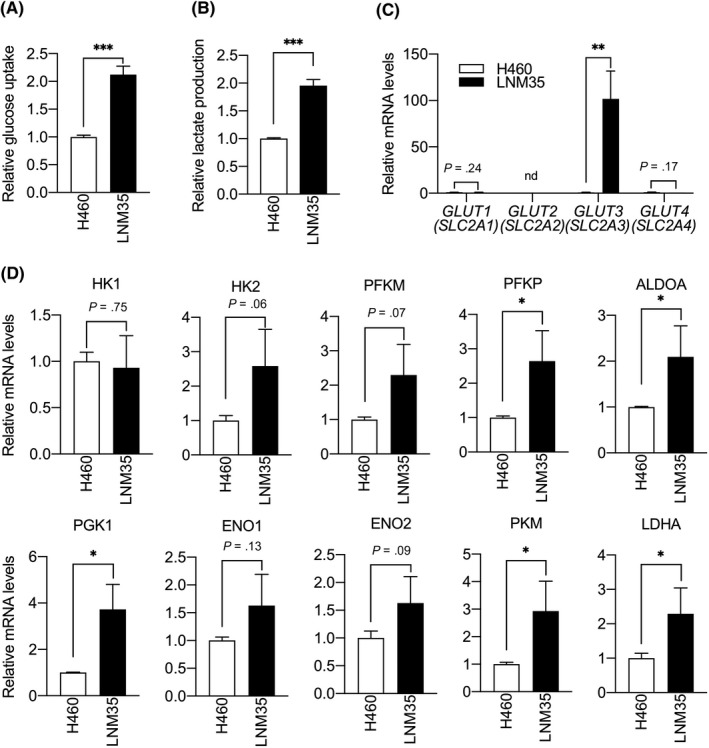
Aggressive lung cancer cells show increased glycolytic metabolism and glucose transporter 3 (GLUT3) expression. A, Relative glucose uptake in H460 and LNM35 cells. Levels in H460 cells were set to 1. Data are means ± SD; n = 3 per group. ***P < .001, unpaired t test. B, Relative lactate production in H460 and LNM35 cells. Levels in H460 cells were set to 1. Data are means ± SD; n = 4 per group. ***P < .001, unpaired t test. C, Comparison of levels of GLUT1‐4 (SLC2A1‐4) transcripts in H460 and LNM35 cells. Levels in H460 cells were set to 1. Data are means ± SD; n = 3 per group. nd, not detected. **P < .01, unpaired t test. D, Comparison of levels of indicated transcripts in H460 and LNM35 cells. Levels in H460 cells were set to 1. Data are means ± SD; n = 3 per group. *P < .05, unpaired t test. ALDOA, aldolase fructose‐bisphosphate A; ENO, enolase; HK, hexokinase; LDHA, lactate dehydrogenase A;PFKM, phosphofructokinase muscle; PFKP, phosphofructokinase platelets; PGK1, phosphoglycerate kinase 1; PKM, pyruvate kinase M
