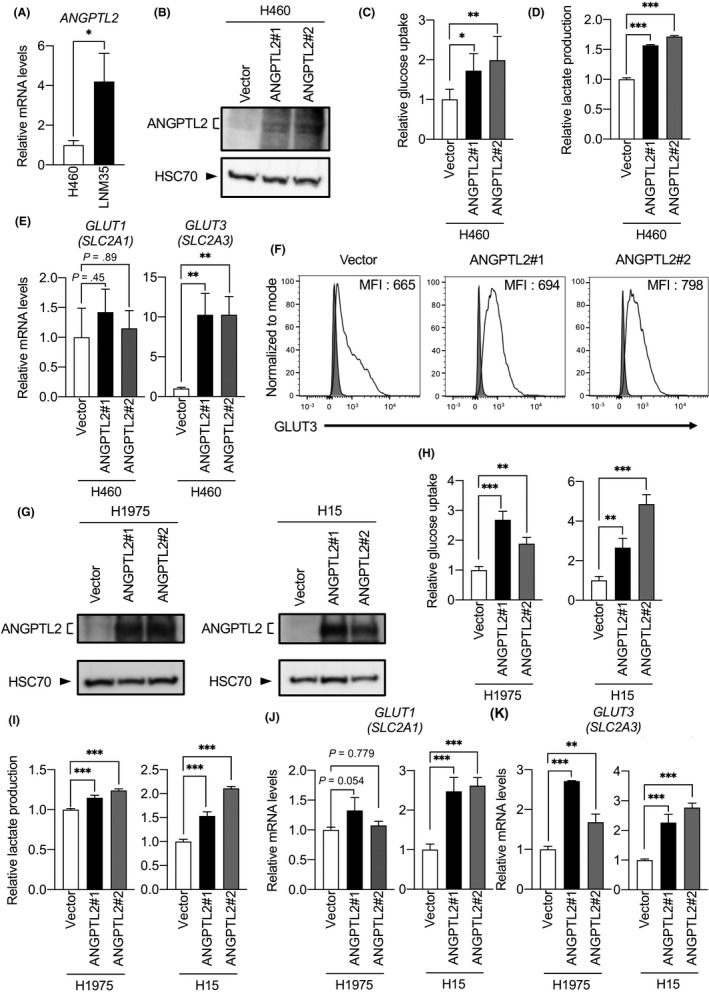
Figure 2.

Angiopoietin‐like protein 2 (ANGPTL2) increases glucose transporter 3 (GLUT3) expression and glycolytic metabolism. A, Comparison of levels of ANGPTL2 transcripts in H460 and LNM35 cells. Levels in H460 cells were set to 1. Data are means ± SD; n = 3 per group. *P < .05, unpaired t test. B, Representative immunoblotting for ANGPTL2 in H460/ANGPTL2 and H460/vector cells. Heat shock cognate protein 70 (HSC70) served as a loading control. C, Relative glucose uptake in H460/ANGPTL2 and H460/vector cells. Levels in H460/vector cells were set to 1. Data are means ± SD; n = 6 per group. *P < .05, **P < .01, one‐way ANOVA test followed by Tukey's multiple comparison test. D, Relative lactate production in H460/ANGPTL2 and H460/vector cells. Levels in H460/vector cells were set to 1. Data are means ± SD; n = 3 per group. ***P < .001, one‐way ANOVA test followed by Tukey's multiple comparison test. E, Comparison of levels of GLUT1 (SLC2A1) and GLUT3 (SLC2A3) transcripts in H460/ANGPTL2 and H460/vector cells. Levels in H460/vector cells were set to 1. Data are means ± SD; n = 3 per group. **P < .01, one‐way ANOVA test followed by Tukey's multiple comparison test. F, Representative profiles showing cell surface expression of GLUT3 (black line traces) or isotype‐matched control (gray filled traces) in H460/ANGPTL2 and H460/vector cells, as assessed by flow cytometry analysis. Gating of living cells was carried out after background assessment. MFI, median fluorescence intensity. G, Representative immunoblotting for ANGPTL2 in H1975/ANGPTL2 and H1975/vector cells, and in H15/ANGPTL2 and H15/vector cells. HSC70 served as a loading control. H, I, Relative glucose uptake and lactate production in H1975/ANGPTL2 and control cells, and H15/ANGPTL2 and control cells. Levels in respective vector control cells were set to 1. Data are means ± SD; n = 3 per group. **P < .01, ***P < .001, one‐way ANOVA test followed by Tukey's multiple comparison test. J, K, Comparison of levels of GLUT1 (SLC2A1) and GLUT3 (SLC2A3) transcripts in H1975/ANGPTL2 and control cells, and H15/ANGPTL2 and control cells. Levels in respective vector control cells were set to 1. Data are means ± SD; n = 3 per group. **P < .01, ***P < .001, one‐way ANOVA test followed by Tukey's multiple comparison test
