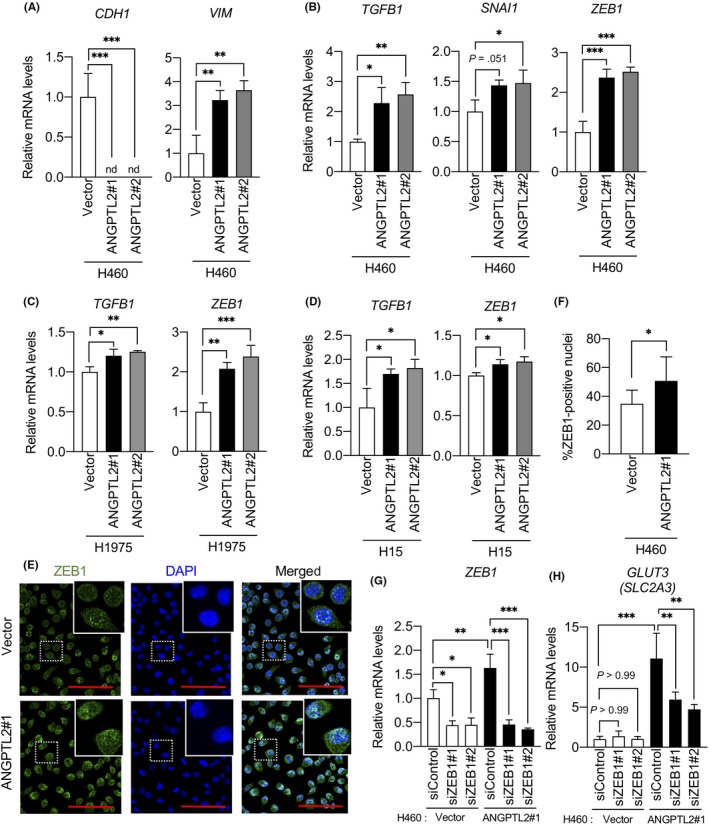
Figure 3.

Angiopoietin‐like protein 2 (ANGPTL2) induces glucose transporter 3 GLUT3 expression through zinc finger E‐box binding homeobox 1 (ZEB1). A, B, Comparison of levels of indicated transcripts in H460/ANGPTL2 and H460/vector cells. Levels seen in H460/vector cells were set to 1. Data are means ± SD; n = 3 per group. *P < .05, **P < .01, ***P < .001, one‐way ANOVA test followed by Tukey's multiple comparison test. C, D, Comparison of levels of indicated transcripts in H1975/ANGPTL2 and control cells, and in H15/ANGPTL2 and control cells. Levels in respective vector control cells were set to 1. Data are means ± SD; n = 3 per group. *P < .05, **P < .01, ***P < .001, one‐way ANOVA test followed by Tukey's multiple comparison test. E, Immunofluorescent staining for ZEB1 (green) in H460/ANGPTL2 and H460/vector cells. Nuclei are counterstained with DAPI (blue). Scale bar = 100 μm. Insets show magnified images. F, Quantification of ZEB1‐positive nuclei. Data are means ± SD; n = 8 per group. *P < .05, unpaired t test. G, H, Comparison of levels of indicated transcripts in H460/ANGPTL2 and H460/vector cells transfected with ZEB1‐specific siRNAs (siZEB1#1 or siZEB1#2) or negative control siRNA (siControl). Levels in control siRNA H460/vector cells were set to 1. Data are means ± SD; n = 3 per group. *P < .05, **P < .01, ***P < .001, one‐way ANOVA followed by Tukey's multiple comparison test
