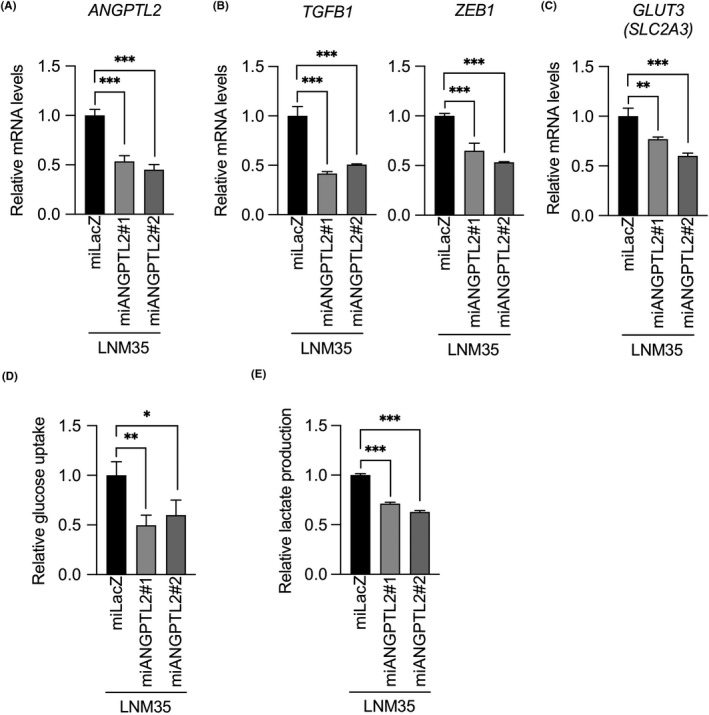
Figure 5.

Angiopoietin‐like protein 2 (ANGPTL2) knockdown in lung cancer cells decreases glycolytic metabolism. A‐C, Comparison of levels of indicated transcripts in ANGPTL2 knockdown (miANGPTL2#1 and miANGPTL2#2) and control (miLacZ) LNM35 cells. Levels in control cells were set to 1. Data are means ± SD; n = 3 per group. **P < .01, ***P < .001, one‐way ANOVA followed by Tukey's multiple comparison test. D, Relative glucose uptake in ANGPTL2 knockdown and control LNM35 lines. Levels in control cells were set to 1. Data are means ± SD; n = 3 per group. *P < .05, **P < .01, one‐way ANOVA followed by Tukey's multiple comparison test. E, Relative lactate production in ANGPTL2 knockdown and control LNM35 lines. Levels in control cells were set to 1. Data are means ± SD; n = 3 per group. ***P < .001, one‐way ANOVA followed by Tukey's multiple comparison test
