
Figure 3.
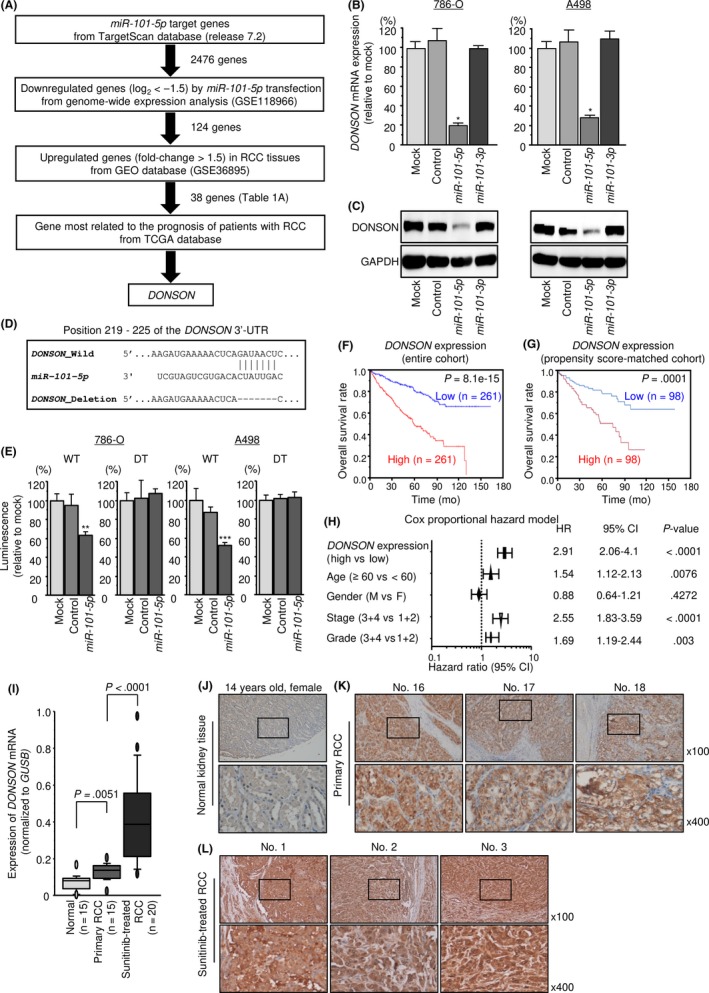
miR‐101‐5p candidate target gene and its clinical significance. A, Strategy for searching for oncogenes targeted by miR‐101‐5p in clear cell renal cell carcinoma (ccRCC). B, DONSON mRNA expression levels 48 h after transfection of ccRCC cells with 10 nM miR‐101‐5p or miR‐101‐3p. GAPDH was used as an internal control. C, Protein expression of DONSON 72 h after transfection with miR‐101‐5p or miR‐101‐3p. GAPDH was used as a loading control. D, E, Dual luciferase reporter assays with vectors encoding the putative miR‐101‐5p target site in the WT DONSON 3′‐UTR and a 3′‐UTR with the target sites deleted (deletion‐type (DT)). Normalized data were calculated as the ratio of Renilla/firefly luciferase activities. F, G, Kaplan‐Meier analyses for overall survival in the entire cohort and propensity score‐matched cohort. Patients were divided into 2 groups according to DONSON expression levels: high expression (red line) and low expression (blue line). H, Multivariate analysis of overall survival with clinical parameters, including DONSON expression. I, DONSON mRNA expression levels in normal, primary (sunitinib‐naïve) ccRCC and sunitinib‐treated ccRCC patients. J‐L, Immunostaining showed the expression of DONSON in normal kidney tissue, primary ccRCC, and sunitinib‐treated ccRCC (100× and 400× magnification fields). *P < .0001; **P < .005; ***P < .01. CI, confidence interval; GEO, Gene Expression Omnibus; TCGA, The Cancer Genome Atlas