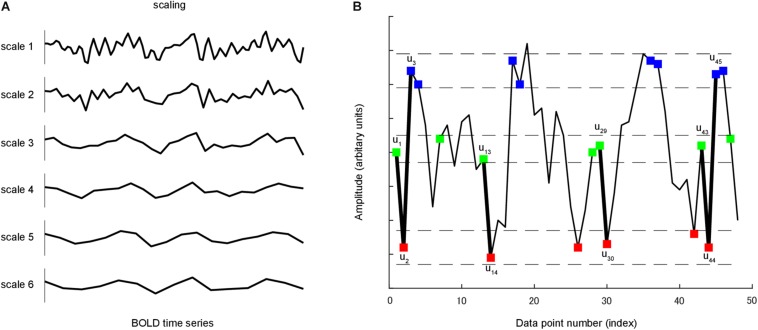
FIGURE 1.
(A) A coarse-graining process was applied to time series. For a given time series, multiple coarse-grained time series were constructed by averaging the data within non-overlapping windows of increasing length. (B) A time series u is shown to illustrate the procedure for calculating sample entropy. In this case, the pattern length m is 2, and the similarity criterion r is 0.3 of the standard deviation of u. Dotted horizontal lines around u1, u2 and u3 represent u1 ± r, u2 ± r and u3 ± r, respectively. Two data values match each other, that is, they are not distinguishable, if the absolute difference between them is less than r. Green, red and blue points represent points that match u1, u2 and u3, respectively. Consider the m-component green-red template sequence (u1, u2) and (m + 1)-component green-red-blue (u1, u2, u3) template sequence. For the segment shown, three green-red sequences matched the template, whereas only one green-red-blue sequence matched the template. In this case, the numbers of sequences matching the two- and three-component template are 3 and 1, respectively. These calculations were repeated for the next two- and three-component template sequences. The numbers of sequences that matched each of the two and three components were added to the previous values. This procedure was repeated for all other possible template to determine the ratio between the total numbers of two- and three-component template matches. Sample entropy is the natural logarithm of this ratio.

